Bullish; aiming 3000 maybe higherDuring the struggle and ups then down and now finally shine is up ahead.
Ima keep this short; i like Ether to hit 3000. But getting back to the yearly ATH ( 4,885) is possible.
First back to 2600 then 3000. But 4,100 is the huge resistance that the bulls need to break. If the bulls keep this momentum bullish even upside then its possible to hit the milestone 5000.
Hold onto your bags
And be sure to use proper risk management
ETHBULLUSD trade ideas

Potential bullish rise?Ethereum (ETH/USD) is falling towards the pivot and could bounce to the 1st resistance which has been identified as a pullback resistance.
Pivot: 2,098.80
1st Support: 1,941.25
1st Resistance: 2,384.00
Risk Warning:
Trading Forex and CFDs carries a high level of risk to your capital and you should only trade with money you can afford to lose. Trading Forex and CFDs may not be suitable for all investors, so please ensure that you fully understand the risks involved and seek independent advice if necessary.
Disclaimer:
The above opinions given constitute general market commentary, and do not constitute the opinion or advice of IC Markets or any form of personal or investment advice.
Any opinions, news, research, analyses, prices, other information, or links to third-party sites contained on this website are provided on an "as-is" basis, are intended only to be informative, is not an advice nor a recommendation, nor research, or a record of our trading prices, or an offer of, or solicitation for a transaction in any financial instrument and thus should not be treated as such. The information provided does not involve any specific investment objectives, financial situation and needs of any specific person who may receive it. Please be aware, that past performance is not a reliable indicator of future performance and/or results. Past Performance or Forward-looking scenarios based upon the reasonable beliefs of the third-party provider are not a guarantee of future performance. Actual results may differ materially from those anticipated in forward-looking or past performance statements. IC Markets makes no representation or warranty and assumes no liability as to the accuracy or completeness of the information provided, nor any loss arising from any investment based on a recommendation, forecast or any information supplied by any third-party.

PROJECTION, Possible accumulation on 4H chart in ETH/USDTPROJECTION, Possible accumulation on 4H chart in ETH/USDT
In 1H, purchases (long) are expected within 7 to 8 hours, from $2,172 and exits at $2,273.

ETHUSD Short: Break of a 2 year trendlineA simple short idea only because of a break in the longer-term trendline. Nothing sophisticated.

EthereumETHUSD ( Ethereum / U.S Dollar )
This Analysis is based on these Factors :
1. Bearish Channel
2. Elliot Waves
3. Point of Interest
4. Break of Structure
5. S / R Level


Bearish Continuation or Rebound Ahead ?
The bands are widening, indicating increased volatility.
Price has been hugging the lower Bollinger Band, suggesting a strong downtrend.
Increased Volume on Sell-Off: The recent strong bearish move was accompanied by high volume, confirming strong selling pressure.
Possible Capitulation?: If volume spikes further while price stabilizes, it could indicate potential short-term bottoming.
Support: Around $2,000 (psychological level).
Resistance: Near $2,500 - $2,600 (recent breakdown level & middle Bollinger Band).
Bearish Bias: Price action and indicators suggest further downside unless buyers step in strongly.
Short-term Relief Bounce Possible: If ETH holds the $2,000 level, a temporary rebound could occur.
Bearish Scenario: If ETH closes below $2,000, expect further downside toward $1,800 or lower.
Bullish Recovery: A strong close above $2,500 would indicate potential trend reversal.
Wait for Confirmation: Watch for a bullish reversal pattern or volume divergence before entering long positions.

ETHUSD POSSIBLE BUY?The market is currently testing the current Weekly area.
Based on Daily, the market seems to be forming a possible reversal pattern which could lead to a possible reversal.
We could seeBUYERS coming in strong should the current level hold.
Disclaimer:
Please be advised that the information presented on TradingView is solely intended for educational and informational purposes only.The analysis provided is based on my own view of the market. Please be reminded that you are solely responsible for the trading decisions on your account.
High-Risk Warning
Trading in foreign exchange on margin entails high risk and is not suitable for all investors. Past performance does not guarantee future results. In this case, the high degree of leverage can act both against you and in your favor


Eth to go to new ATH soonIn this trade set up, you can see the bottom GOLD line is the support which we will bounce off and then start working our way back up the chart. However if the RED line is broken, we will see a massive sell off

ETHUSD (Ethereum)A follow up from this:
Looking at the upmove from the $880 bottom in June'22, it's tough to consider an impulsive count. Since ETH has lagged compared to Bitcoin, the so called Alt season may take much longer than expected. Bitcoin completing it's cycle doesn't necessarily mean the Alt season begins simultaneously.
It will be interesting to watch this in the next few months. If this turns out well, I would expect a very sharp fall in the coming weeks (a noticeable quality in Wave c). However, those levels would give amazing opportunities in Eth and the other few good Altcoins.

ETH in front of capitulation- there is a reason this bull market cycle hardly felt like a bull market at times and that reason is ETH underperformance
- with bitcoin breaking down, it seems likely the two year long underperformance for ETH is crowned with a single capitulation event that wipes out even the strongest of believers
- price action in an ascending broadening wedge, same goes for the monthly RSI
- price target anywhere between 900 - 1200

See previous post for contextVisit the previous post to see why I was not interested in Longs especially not at highs and not even in Fair Value of the Sunday move up

ETHUSD is expected to fall below the $2,000On the weekly chart, ETHUSD continues to decline, with an obvious bearish trend. Currently, the effective support below is at the 2000 mark, and if it falls below, it will fall further, with the downward target looking at the 1520-1755 area.

Ethusd...Buy trendBased on the analysis of the ETHUSD trade idea, here's a structured summary and evaluation:
---
### *Trade Analysis Summary: ETHUSD Long*
*1. Technical Factors:*
- *Trend Line Rebound:* Price rebounded from a key long-term support, suggesting potential reversal or continuation of an uptrend. Validate the trend line with historical touches (e.g., 3+ prior bounces).
- *CCI Indicator:* Oversold signal (CCI < -100) breaking upward, hinting at bullish momentum. Confirm with RSI/MACD convergence to avoid false signals in a downtrend.
*2. Fundamental Catalyst:*
- *Trump Crypto Fund News:* Positive sentiment from political adoption, but verify:
- Has the market already priced this in? Check price action post-announcement.
- Regulatory implications (e.g., SEC stance on Ethereum as a security).
*3. Entry & Risk Management:*
- *Entry Trigger:* Define "further growth" (e.g., break above $2,950 resistance or a 1-hour close above the 50-period EMA).
- *Stop-Loss (SL):* Essential for risk control. Place below the trend line (e.g., $2,700) or recent swing low.
- *Targets:*
- *Target 1 ($3,100):* Aligns with June 2024 resistance or 61.8% Fibonacci retracement.
- *Target 2 ($3,500):* Psychological level and previous swing high (March 2024).
*4. Confluence Checks:*
- *Volume:* Confirm rising volume on the rebound for stronger conviction.
- *Market Sentiment:* Monitor Bitcoin’s movement (ETH often correlates) and crypto fear/greed index.
- *Futures Data:* Negative funding rates could indicate short-squeeze potential.
*5. Risks:*
- False breakout if trend line fails or news lacks follow-through.
- Macro risks (Fed policy, geopolitical events) impacting crypto as a risk asset.
---
### *Recommendation:*
- *Execute Long IF:*
- Price holds above trend line with bullish candle closes.
- CCI sustains above -100 and RSI > 50.
- Volume increases on upward moves.
- *Avoid IF:*
- ETH closes below trend line or shows weak momentum (low volume).
*Adjusted Trade Plan:*
- *Entry:* $2,900–$2,950 (confirmed breakout).
- *SL:* $2,700 (-7–10% risk).
- *Targets:* $3,100 (6% gain), $3,500 (20% gain).
- *Risk/Reward Ratio:* ~1:3 (favorable).
---
Always scale in/out and monitor news for sudden shifts. 🚀


Time to Bounce back BullishAs a fib tool with the main trend line, we can see that the price is already touch the main trend line, we have a big chance for bounce back after droping from 3,920 blue line average on fib tool, if the price break through the main trend line, then we are going to see a price drop to the next support level at 1,550
but all indicators shows a 90% a chance for bullish

ETH long term bullish scenario#ETH triangle is still valid !
the market took the lower prices liq and now its ready for a huge rise !
the triangle has 5 waves like ABCDE and i think there will be no more big correction remaining so its better to take some eth and hold it for a long time !


Eth lack of volumeEth's pric action yesterday was not backed by strong volume indicating a high probability of stalling or worse a reversal.

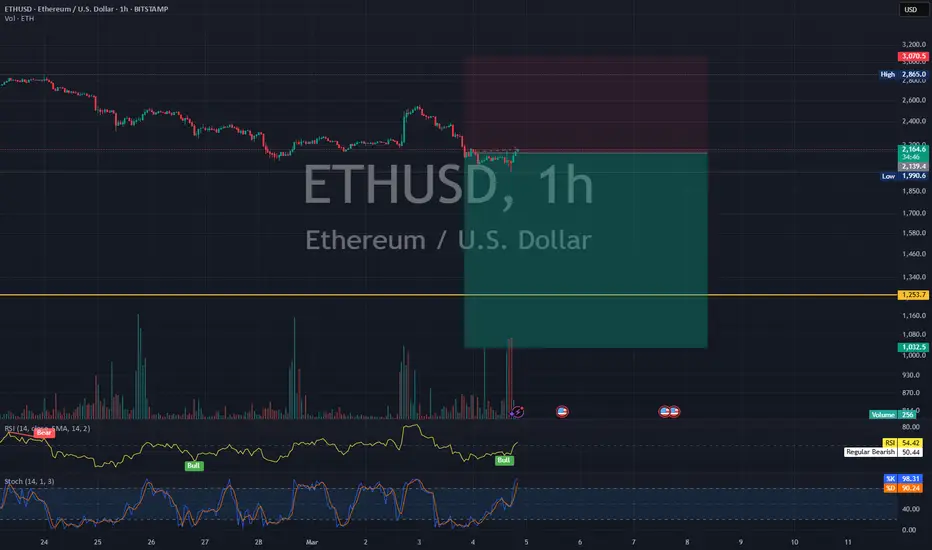
Ethereum 1 hour chartThat "crypto reserve" news is getting sold hard.
Just insane. Ethereum has now given up all gains and is BELOW the start of the pump.
Chart traders knew there was no low risk entries and that the next one might be much later down the road.

ETH WORST SCENARIO !#ETH worst scenario is like this ! the 5 rising waves are made and now the market should make an ABC pattern but its just a possibility ! there is lots of demand zones which can stops the market from going down and we should be careful about that !
