Eth 2:1 or 4:1 what do you see coming?
1:1 might be more like it depending on how things change over the next days to few weeks.
is it time for another 1-2 weeks consolidation.
how will the daily candle close? Wick in the pocket or Bold and below?
ETHBULLUSD trade ideas

current thoughts on EthIf we push passed here, were pretty cooked but were reaching a very strong support and just had a big volume spike so im bidding.

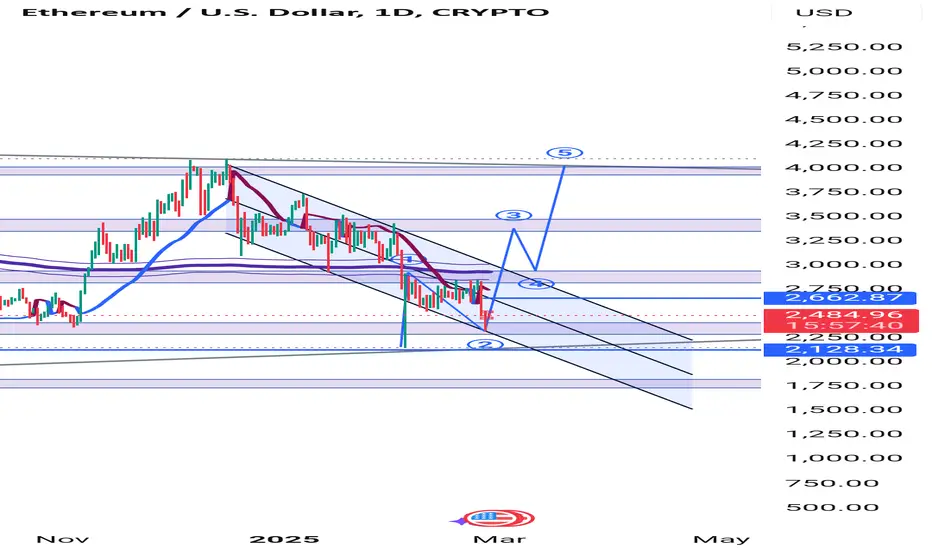
Ethereum: The Final Capitulation - Massive Bull Run Incoming!This is it! As long as the price of ETH remains above 2127.94, this count is valid. There is a clear completion of Wave (5) of c of (II). This is an extremely attractive level for buyers for the long-term.
There is an extreme level of fear in the Crypto market right now, this is the time to go against the market, this is where you make the most gains. I'm more bullish than I have ever been on ETH.
Warren Buffet says "Be greedy when others are fearful and be fearful when others are greedy".
Let me know what you think, is this the final capitulation or not?
Good luck!

CRYPTO BLOODBATHA long term structure has broken down. We may be seeing the beginning of a bloodbath. I've sold everything to rebuy later. This is going to be MESSY.

ETHUSD about to Create and All Time HIGH!!!ETHUSD looks like it's ready for an all time high.
Holding the $2400 level quite strong.
Maybe see a push into the $2k or $1618 price point which I highly doubt.
$7500 here we come ETH

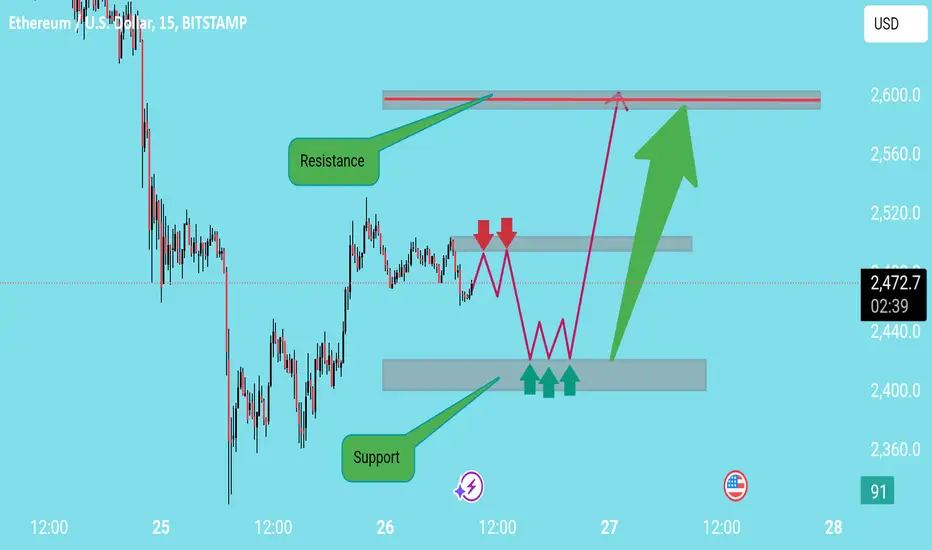
ETHUSD surely analysis 1. Support and Resistance Reliability
The analysis assumes a strong support zone at the lower level and a firm resistance at the top.
However, support and resistance levels are not static—they can be invalidated if momentum is strong
If the price revisits support too many times, it could break down instead of bouncing.
2. Repetitive Range-Bound Expectation
The chart predicts multiple rejections at the middle resistance before a breakout.
Markets don’t always behave in such a predictable pattern—sideways action could lead to a sudden breakdown instead of a breakout.
3. Lack of Volume & Trend Confirmation
There's no volume analysis to confirm if support and resistance levels are strong.
A higher time frame (1H or 4H) analysis would help validate if this is just consolidation or a genuine trend reversal.
4. Breakout vs. Fakeout Possibility
The projection assumes a clean breakout above resistance.
However, many breakouts turn into fakeouts, where price moves above resistance, traps buyers, and then reverses sharply.
A liquidity grab above resistance could lead to a drop instead of a rally.
Alternative Perspective
Instead of assuming a clear upward movement, consider two scenarios:
1. Bullish Case: If volume supports the breakout, enter after a successful retest of resistance as support.
2. Bearish Case: If the breakout fails (fakeout), expect a retest and breakdown, leading to a lower support level
This is buy time buy and holdEthereum done it's correction phase. Time to buy till recent high till 4000 apx
ETHUSD BULLISH BATHarmonic Pattern Trading Strategy:
1. Combine patterns with 2-3 confirmations (e.g., MA, BB, RSI, Stoch) for increased accuracy.
2. Implement proper risk management.
3. Limit exposure to 3% of capital per trade.
4. Exercise caution: Not every Harmonic Pattern presents a good trading opportunity.
5. Conduct thorough diligence and analysis before trading.
Disciplined approach = Enhanced edge.

(ETH) ethereumWhen can we expect to see reports on the new concepts about Ethereum in the future?
Buying mode, price of Ethereum well under the dotted line. Ethereum has not had a strong position for some time and is likely to find profits. One large drop in price does not usually follow another than another than another and especially not with such large volume and capital. Am I in control of the flow, no. Do I have billions to make heavy movements, no. Am I interested in the progress of Ethereum despite holding little to no value in Ethereum, yes.

LONG ON ETHEREUM (ETH/USD)Ethereum is currently at a major level of support.
The last time Ethereum was at this price was Nov of 2024 and ended up rising over 1600 points within a month.
I expect Ethereum to do the same thing!
I will be buying eth to the next level of supply/resistance.

ETH Is Always "Dead" On Support MartyBoots here , I have been trading for 17 years and sharing my thoughts on ETH here.
ETH is looking beautiful , very strong chart for more upside if this support can hold
Do not miss out on ETH as this is a great opportunity
Watch video for more details

Yes, it's this simple.This is the monthly trend for eth, with supports and resistances exactly parallel.

Ethereum (ETH/USD) – Scalping & Mid-Term Analysis🔥 Market Overview:
Trend: Strong Bearish
Resistance Levels: $2,417 – $2,456 (EMA 200)
Support Levels: $2,360 – $2,320
Volume & Liquidity: Selling pressure remains dominant
Indicators:
MACD: Bearish momentum, but slightly improving
RSI: Oversold (33), showing potential for a small bounce
EMA 9 & 200: Strong downtrend confirmation
Market Maker Moves: Stop hunts possible near $2,360
🔥 Scalping Strategy:
🩸 1. Buy near: $2,360 – $2,380
Target 1: $2,410 (+2.1%)
Target 2: $2,450 (+3.81%)
Stop-Loss: Below $2,320
🩸 2. Short near: $2,410 – $2,450
Target 1: $2,360 (-2%)
Target 2: $2,320 (-3.73%)
Stop-Loss: Above $2,480
🔥 Mid-Term Trend Forecast (1-3 Weeks):
Bearish Continuation: Below $2,400, ETH may retest $2,300
Bullish Reversal: A breakout above $2,480 could push ETH back to $2,600
⚡ News & Market Context:
$292M in ETH long liquidations: Heavy selling impact
General crypto market correction: ETH follows BTC's downtrend
Exchange Liquidity Clusters: Key short liquidations below $2,320
💰 Profit Calculation & ROI:
Long:
Profit: +3.81%
ROI: +19.06%
Short:
Profit: +3.73%
ROI: +18.67%
👑 Trade Rating (1-10):
Long Setup: 6/10 (Potential bounce, but risky)
Short Setup: 8/10 (Safer due to bearish trend)
🔥 Decision:
🩸 Short-term: Scalp long from $2,360 but with caution
🩸 Mid-term: Favor shorts unless ETH reclaims $2,480
🩸 Ideal Play: Short from $2,450, targeting $2,320
🔥 Best Asset for Scalping: ETH is good, but BTC has stronger liquidity
👑 Final Verdict: Scalp cautiously, prioritize shorts!
🔥 FinCaesar:
"Only fools chase the past—trade the present with precision."

ETH Bearish breakout below 2,690The Ethereum (ETHUSD) price action sentiment appears bearish, supported by the longer-term prevailing downtrend.
The key trading level is at 2,690, the previous support level. An oversold rally from the current levels and a bearish rejection from the 2,690 level could target the downside support at 2,450 followed by 2,340 and 2,190 levels over the longer timeframe.
Alternatively, a confirmed breakout above 2,690 resistance and a daily close above that level would negate the bearish outlook opening the way for further rallies higher and a retest of 2,785 resistance followed by 2,940 levels.
This communication is for informational purposes only and should not be viewed as any form of recommendation as to a particular course of action or as investment advice. It is not intended as an offer or solicitation for the purchase or sale of any financial instrument or as an official confirmation of any transaction. Opinions, estimates and assumptions expressed herein are made as of the date of this communication and are subject to change without notice. This communication has been prepared based upon information, including market prices, data and other information, believed to be reliable; however, Trade Nation does not warrant its completeness or accuracy. All market prices and market data contained in or attached to this communication are indicative and subject to change without notice.

ETH Update | ICT Distribution Setup - $2.2k as PlannedMy latest posts on ETH was to see a falling wedge breakout to the upside when price was trading around $3.5k
At the same time I was shorting the pivot points inside the wedge
Chart patterns are fine to use here and there but in all realness Market Cycles overpower when using true price action analysis.
I had a hunch price would fall lower at the time but was trying to force a bullish bias which is bad, and could have let the positions run for longer.
Now that we're at a major support level I would like to see some type of accumulation pattern/consolidation before we make a call for $3k
Market Horizon:
Looking to see a market-wide bounce in the months of April, possible pullback/selloff in May. For now we wait🧘♂️

Ethereum Reversal Zone - Simple Elliott WaveA simple Wave (I) & (II), next I'm expecting buyers to come in here and take the price of ETH to ATH. This increased level of volatility is a good sign and it should be mirrored to the upside in the short-term.
Let me know what you think, is this the reversal zone or is ETH heading past the invalidation point?
Good luck!

18KIf you bet your money on this chart and you lose money, it’s your fault. This is pure speculation and if you put your money somewhere because of someone’s speculation then you deserve to lose money. With all that being said, yes, I think ETH is going to 18k and there’s a lot of scared little babies around panicking because of a drop. Parallel lines are very simple geometric structures, yet so important in every single aspect of life including mathematical charts. This is one example. Sit down like a good child and study the parallel channels. You will need them.


Ready for PUMP or what ?The price has formed a Triangle on the 4h time frame, and if it breaks out, it can drive the price up to around $3000 .
Give me some energy !!
✨We spend hours finding potential opportunities and writing useful ideas, we would be happy if you support us.
Best regards CobraVanguard.💚
_ _ _ _ __ _ _ _ _ _ _ _ _ _ _ _ _ _ _ _ _ _ _ _ _ _ _ _ _ _ _ _
✅Thank you, and for more ideas, hit ❤️Like❤️ and 🌟Follow🌟!
⚠️Things can change...
The markets are always changing and even with all these signals, the market changes tend to be strong and fast!!

Ethereum Near Key Support: Ready to Bounce to 2,900?COINBASE:ETHUSD is approaching a significant support level, marked by historical price reactions and strong buying interest. This area has consistently acted as a key demand zone, signaling the potential for a bullish reversal if buyers regain control.
If the price confirms a rejection within this demand zone, I anticipate an upward move toward the 2,900 level, which aligns with a key resistance area and a logical retracement point. The confluence of the demand zone, volume profile support, and long-term trendline strengthens the case for a bullish bounce.
Traders should monitor for bullish confirmation signals, such as bullish candlestick patterns, higher lows, or increasing volume near the demand zone, to validate potential long positions.

eth update i see ABC down to c-wave and to support will most likely bounce of support and start a rally off the 0.786

ETHUSD (LONG)
Elliots Wave (impulse move completed and correction starting.)
Extreme Pivot Areas Reached.

ETH - What to Watch for This Week After many week of consolidating in our triangle, we have finally come to a decision point.
In simple terms, ETH was holding the $2,570-$2,630 range as support and the $2,790-$2,850 level as resistance.
Now, for the first time since creating our uptrend price has created a micro lower low. This has caused price to break down from our triangle which gives us a measured move of a breakdown to around the $2,350 level.
Now it is possible for price to rebound to the $2,630-$2,690 level to retest our old support as new resistance. If that scenario does play out and sellers come in at our trendline of old support then expect downside momentum to continue to that downside target (this would likely coincide with BTC dropping below $90k once more).
Macro timeframes are still bullish with ETH maintaining its 200 MA on the weekly, and the 21 and 50 MA on the monthly.
If we can reclaim our old support trendline again then the short term momentum will flip back to the upside. But our market structure right now is signaling a slight push lower either very soon or if that trendline of old support gets tested and sellers turn that into a level of resistance.
