Major resistance level ahead?Ethereum (ETH/USD) is rising towards the pivot which has been identified as a pullback resistance and could fall to the 1st support which acts as a pullback support.
Pivot: 3,026.35
1st Support: 2,468.89
1st Resistance: 3,408.31
Risk Warning:
Trading Forex and CFDs carries a high level of risk to your capital and you should only trade with money you can afford to lose. Trading Forex and CFDs may not be suitable for all investors, so please ensure that you fully understand the risks involved and seek independent advice if necessary.
Disclaimer:
The above opinions given constitute general market commentary, and do not constitute the opinion or advice of IC Markets or any form of personal or investment advice.
Any opinions, news, research, analyses, prices, other information, or links to third-party sites contained on this website are provided on an "as-is" basis, are intended only to be informative, is not an advice nor a recommendation, nor research, or a record of our trading prices, or an offer of, or solicitation for a transaction in any financial instrument and thus should not be treated as such. The information provided does not involve any specific investment objectives, financial situation and needs of any specific person who may receive it. Please be aware, that past performance is not a reliable indicator of future performance and/or results. Past Performance or Forward-looking scenarios based upon the reasonable beliefs of the third-party provider are not a guarantee of future performance. Actual results may differ materially from those anticipated in forward-looking or past performance statements. IC Markets makes no representation or warranty and assumes no liability as to the accuracy or completeness of the information provided, nor any loss arising from any investment based on a recommendation, forecast or any information supplied by any third-party.
ETHBULLUSD trade ideas

Crypto Hedge against Trumpism chaos, destruction and tariffsTrump is going to wreck havoc on the US economy which is why many are hedging against USD with crypto. Inflation, shortages and recession are coming in a few years.
For awhile, Biden policy will prop up USD but once Trump policy kicks in and effects the government, expect food shortages from deportations, recession from tariffs and draconian policy and more wars with Putin unchecked.
Chaos is coming in about year 2 into Trump presidency. Until then I expect positive Biden policies to continue to strengthen US dollar while smart hedgers long crypto the hedge against the chaos that is coming. When not if.

ETH roadmap! ETH is in its re-accumulation phase in which it will go deeper one more time before heading towards 7.000$.
Patience is key! The time will come!

ETH Update!Here is my analysis on ETH, marked zone is the last standing zone for me, if ETH breaks it, it will be bad, for me Eth still is bearish on weekly time frame. However, triangle pattern can turn the tables if it plays right.
Took this trade, will manage accordingly, follow for more ideas.

ETH AAPL TheoryJust my theory about Ethereum potential price action based on Apple chart from the 2012-15.
Let's see!

this is how ethereum runs to 39khere’s your rewrite—cutthroat, precise, and undeniable.
---
they mock ether. they doubt it. they call it dead money.
> while the smart money accumulates.
"ethereum is a stablecoin," retail sneers. blind. short-sighted. drowning in their own ignorance.
> while the smart money accumulates.
your sell is our buy. and our buy is what takes us to the levels i have laid out.
thirty-nine thousand dollars for one ethereum. and you hesitated at two.
i'm not telling you to buy. far from it.
what i am showing you is the beginning.
the ignition of one of the largest alt seasons in history.
happening right now.
right in front of your eyes.
---
cash you on the dark side of the moon
🌙
Bullish DIP: ETH $2530 Before Massive Move to New ATHPrior cycle fractals show that ETH has a macro resistance which lasts multiple years.
Upon touch of resistance at the bottom of wedge it will drop more than 30% - before pumping multiple thousands of percent as the flagship coin for alt season.
This is probably what will happen with the current dip. The entire crypto market is currently being controlled by this phenomena - a one week 'flippening'.
Alts will follow in ETH's lead and the bull market frenzy will truly begin.
Not financial advice, for entertainment only.

ETH 18000 DOLLARS BY SEPTEMBER 2025 God dam what a beautiful day it is , one dreams of such a entry in a bull market.
ETH will hit 18000 dollars by september 2025 there is nothing you can about it , this is the game, leverage wiped out and reset now we enter the "only up period" from this moment .
The key to finding out the next move was the USDT DOM like always pointing the way , the lower higher on the RSI showing divergence.
The money flow on MC indicator was very clearly showing this move , private indicator cant publish it on here.
The Fractal from 2020 on ETH is playing out FORGET THIS HAMMER WICK it is happening from here ETH will close in this channel and rally to 18k!
Do not give in to fear this is where you want to stack as much as possible . Invalidation of idea would be ETH closing a weekly candle under this ascending macro channel .

ETH - Return of the Queen. Ascending triangle & bullish. ETH has been forming a structure for breaking out for a while now. A good buy for mid/long term.

the Inverse Golden BullrunJust a joke maybe but here some considerations...
each peak is reached in 1/0.606 * previous cycle length, which is oddly close to the inverse of the golden ratio. The Q1 peak in 2024 seems to have occurred oddly in advance.
Resistance of bear markets can be found at a common focal points and all have an angle of approx 20° on the linear scale.
this inverse golden bullrun will produce a very turbolent market with a new local top in 2025. This seems reasonable considering the whole global situation, crypto narrative, oversaturation and how we got rejection before breaking the past ATH.
the overall superstructure could break out or be confirmed after next "inverse golden bullrun"
oddly again, should the breakout occurr, it would happen around 1/3rd of the triangle, which is typical for those structures.
overall, not bullish nor bearish, don't hate.
most certainly mostly wrong ;)
not a financial advice, just for fun.

ETHUSD sell trade planAfter taking IRL (DFvG) the price is on course to ERL. The trade plan is on DTF.


$ETH just have a good look where the Earthquake stoppedCRYPTOCAP:ETH tests the bottom of this Rectangle I have had on my chart forever. It started back in 2023.
To the T!
More on that later, reviewing the situation right now 💙👽

ETH – What Happened? A Detailed Breakdown and What to do next!Crypto Panic or Manipulation? Breaking Down Ethereum’s Crash and the Entire Market
🔥 Hello everyone, this is Ronin!
The last two trading days have seen one of the biggest crashes in the history of the cryptocurrency market. 📉 We witnessed a massive wave of liquidations that burned through the capital of many traders.
Looking at the numbers:
Most assets lost 10–30% of their value.
Some altcoins dropped by 50%.
The total crypto market capitalization shrank by more than 10% in just a few days.
But the biggest victim of this crash was not Bitcoin, nor low-cap altcoins—it was Ethereum (ETH) itself.
What Happened to Ethereum? Why Did It Drop from $3600 to $2000?
If we talk about the strangest asset in this cycle, Ethereum stands out.
While other coins were breaking all-time highs, ETH didn’t even come close to its peak valuation. This is despite:
The launch of Bitcoin ETFs, bringing in a wave of institutional capital.
News that Donald Trump was reportedly buying ETH for his projects.
Growing interest in L2 scaling solutions and Ethereum network upgrades.
None of these bullish catalysts helped ETH break even $4000.
And then, within just four days, Ethereum plunged from $3600 to $2000. On Binance’s futures market, the price briefly hit $2080.
❓ Has Ethereum ever seen such a sharp drop before?
Personally, I don’t remember such a massive drop happening in such a short time without catastrophic fundamental events.
This wasn’t a network hack, a mining ban, or a major DeFi collapse—nothing fundamentally bad happened.
So who crashed the market, and why?
Who Benefited from This Crash?
Let’s analyze the key question: who had the most to gain from this crash?
The obvious answer is that the biggest winners were major crypto exchanges and market makers.
Why Didn’t Bitcoin Drop as Much?
At the time of the crash:
📌 Bitcoin’s liquidation zones were nearly empty. Many traders had both buy and sell orders in place, so there was no strong incentive to push BTC down.
What About Ethereum?
📉 ETH futures open interest exceeded tens of billions of dollars.
📉 Leverage was heavily skewed towards long positions, meaning liquidations brought massive profits to exchanges.
📉 ETH’s open interest was even higher than BTC’s, making it a prime target for manipulation.
How Crypto Exchanges Made $2 Billion in One Night
The cryptocurrency market is unique because the major players not only provide liquidity but also profit from liquidations.
💰 Crypto exchanges are not just trading platforms—they are global market makers who actively move prices.
📌 On Sunday night, the following happened:
Big players spotted an overloaded leverage in ETH long positions.
They triggered a wave of sell-offs, forcing liquidations.
On Binance alone, exchanges raked in $2 billion in a single day from liquidations.
⚠ Ask yourself this: if you had the power to make $2 billion in a single day, wouldn’t you do it?
Of course, they want to and they do.
How the Smart Money Strategy Works
If you’ve heard of Smart Money trading strategies, you know that big players always think ahead.
📌 The classic scheme:
1️⃣ Pump the market up—give traders confidence that the rally will continue.
2️⃣ Open short positions in zones overloaded with leverage.
3️⃣ Dump the market sharply, triggering stop losses and liquidations.
4️⃣ Buy back at the bottom, raking in billions.
📉 This is exactly what happened with Ethereum—exchanges used a false news narrative about trade sanctions to tank the price.
How I Survived This Crash
🔥 I was long on Ethereum with leverage and held a total position of over 200 ETH.
Honestly, that night was brutal.
📌 When the price dropped to $2080, I had two options:
❌ Panic and close the position, taking a six-figure loss.
✅ Hold and wait for a recovery, because I knew this was a fake move.
I chose the latter. Not only that—I added to my position at the lower levels.
This doesn’t mean the market can’t drop further, but…
📌 Trading rule: Buy when everyone is selling—Sell when everyone is buying.
📌 Right now, the market is in panic mode—which means some smart players are accumulating ETH at these prices.
Conclusion: What Comes Next?
📌 This was an artificial correction—big players intentionally crashed the market.
📌 The coming days should see a recovery, especially if trading volumes start picking up again.
📌 Market psychology is the key factor. When everyone is afraid, that’s when big players accumulate assets.
If you’re interested in how I will navigate my $200,000 ETH drawdown, follow me on TradingView—I’ll be posting regular updates.
🚀 In upcoming articles, we’ll break down the analysis of other altcoins and provide a microeconomic perspective on the most promising assets.
💬 Boost this post if you found it insightful—your engagement helps, and a little positive activity never hurts!
This was Ronin—stay tuned for more updates! Big things are coming. 🎯

Reverse point for ETHSupport & Rebound Potential:
After the strong bearish momentum, ETH has reacted sharply from the support zone, indicating potential buyer interest. A bullish recovery is underway as ETH approaches the previous consolidation range.
Projected Price Action:
The blue projected path suggests a potential bullish breakout following a correction:
Initial Rebound: Price may rise towards the $2,900–$3,000 resistance zone.
Possible Pullback: A minor retracement could occur as sellers test the resistance.
Bullish Continuation: If buyers regain control, ETH could surge towards the $3,800 target level, aligning with historical resistance.
CONTACT @elitetradersJAISINGHCHOUDHARY
thanks


Textbook price action on ETHToday's CRYPTOCAP:ETH price action looks like something straight out of a textbook on technical analysis, where resistance becomes support. Depending on how adventurous you're feeling, you could:
1. Go long now : Set a stop-loss around 2050 (better to choose a non-round number, e.g., 2053) and take profit before the upper support at 4110—say, around 3950. This would yield a reward-to-risk ratio of about 3.5, depending on your entry point.
2. Wait for a pullback : If CRYPTOCAP:ETH drops to the support level around 2115 and holds, consider going long closer to that level, with the same stop-loss as above, and set take profit before the middle support around 2765. Depending on your entry, this strategy can offer a similar reward-to-risk ratio.
3. Test the middle support : If CRYPTOCAP:ETH reaches the middle support at about 2815, observe its behavior. Should that mini-resistance convert into support, go long with a stop-loss at 2705 and take profit at 3950. This setup can provide a great reward-to-risk ratio, depending on where you enter.
4. Consider a short : If the resistance around 2815 holds, you might short CRYPTOCAP:ETH and set take profit a bit before 2115. However, shorting crypto is quite adventurous for my taste—it's better to do so through options to avoid accidentally blowing up your account.

Ethereum (ETH/USD) at a Crossroads: Technical and Macro AnalysisEthereum (ETH) is currently trading at a critical support zone around $2,800 - $2,850, facing key technical levels that could determine its next major move. However, beyond technicals, a significant macroeconomic event—the new U.S. tariffs on Canada, Mexico, and China—could introduce further volatility into the market.
These tariffs, announced by the Trump administration, include a 25% levy on Canadian and Mexican imports and a 10% tariff on Chinese goods. With potential ripple effects on global trade, inflation, and Federal Reserve policy, traders must factor in both technical and macro elements to navigate the Ethereum market effectively.
Ethereum’s Technical Landscape
Long-Term Structure (2W & 1W Charts)
• Ethereum is forming a falling wedge, a traditionally bullish reversal pattern if it breaks to the upside.
• The $2,800 - $2,850 region is a major support zone, with a key resistance area at $3,175 - $3,200.
• Breakout targets could extend to $3,600+, while a breakdown risks testing $2,500 - $2,600.
Medium-Term Outlook (3D & 1D Charts)
• ETH has tested the lower boundary of its descending wedge multiple times, showing strong buying interest.
• Volume has been increasing near support, indicating possible accumulation.
• The RSI (Relative Strength Index) is forming a bullish divergence—while price is making lower lows, RSI is making higher lows, a potential sign of reversal.
Short-Term (4H & 1H Charts)
• Ethereum recently rejected from $3,175, showing continued downward pressure.
• The Stochastic RSI is deeply oversold, suggesting a bounce is possible.
• The Bookmap heatmap shows strong buy liquidity around $2,800, reinforcing support at this level.
Macroeconomic Factors: U.S. Tariffs and Federal Reserve Policy
1. The New U.S. Tariffs
The Trump administration has announced new tariffs on Canada, Mexico, and China, including:
• 25% tariff on Canadian and Mexican imports.
• 10% tariff on Chinese goods.
• Canadian energy exports face a reduced tariff of 10%.
These tariffs are set to take effect on February 4, 2025 and could disrupt global trade, potentially leading to increased production costs in the U.S. economy.
2. Will Inflation Rise?
Historically, tariffs increase costs for businesses, potentially fueling inflationary pressure. However, it’s important to note that:
• During Trump’s first term (2017-2021), similar tariffs did not lead to major inflation.
• Inflation remained relatively stable until COVID-19 supply chain shocks and Federal Reserve monetary expansion in 2020-2021.
However, in the current environment, the impact could be different. With higher baseline inflation and ongoing Federal Reserve concerns, new tariffs may create additional inflationary stress.
3. Federal Reserve Response: Interest Rates & Market Liquidity
• If tariffs cause inflation to rise, the Federal Reserve may delay interest rate cuts—which could strengthen the U.S. dollar (DXY) and pressure risk assets like Ethereum.
• A stronger dollar historically leads to lower ETH prices, as crypto trades inversely to DXY.
• If the Fed maintains high interest rates longer than expected, liquidity in crypto markets may remain tight, limiting ETH upside.
Confluence of Technical and Macro Factors: What’s Next for ETH?
Given both technical and macroeconomic insights, here’s what traders should watch:
Bullish Scenario
✅ $2,800 support holds, leading to a breakout from the falling wedge.
✅ If ETH breaks above $3,175, next resistance at $3,600 comes into play.
✅ A weaker DXY (U.S. dollar) and Fed rate cuts could fuel a major rally.
Bearish Scenario
❌ A break below $2,800 could send ETH down to $2,500 - $2,600.
❌ If tariffs increase inflation and delay Fed rate cuts, ETH could face macroeconomic headwinds.
❌ If the dollar strengthens, ETH may see downward pressure.
Final Thoughts
Ethereum is currently at a major inflection point, both technically and fundamentally. While the falling wedge pattern suggests a potential breakout, macroeconomic factors—including new U.S. tariffs and Federal Reserve rate decisions—could significantly impact price action.
For traders, the $2,800 support zone is critical—holding above this level could fuel a rally, while breaking below it could signal further downside.
Key Levels to Watch:
✅ Support: $2,800 → $2,600 → $2,500.
✅ Resistance: $3,175 → $3,600 → $4,000.
Given the confluence of technical and macroeconomic factors, Ethereum remains a highly volatile asset. Traders should monitor economic data, Federal Reserve statements, and global liquidity trends to stay ahead of the next major move.
📊 What’s your ETH outlook? Share your thoughts below! 🚀

Key support level to holdEth needs to hold this level otherwise 2400 will be next. US markets Free fall tomorrow and things could get dicey. Best to wait to see how support holds and other markets open to determine how best to proceed.

ETHUSD DID ITI doubted ETHUSD will go below 2900 to complete the 3 drive pattern as regards my previous post. I know it is likely but I didnt want it to and now it did.
All doubts regarding the bullish move is now cleared.
If you're still expecting one last purge, you will miss the whole move.
I'm really happy right now.
My followers will make huge chuck of cash this bull season. LFG
TP still remains the same

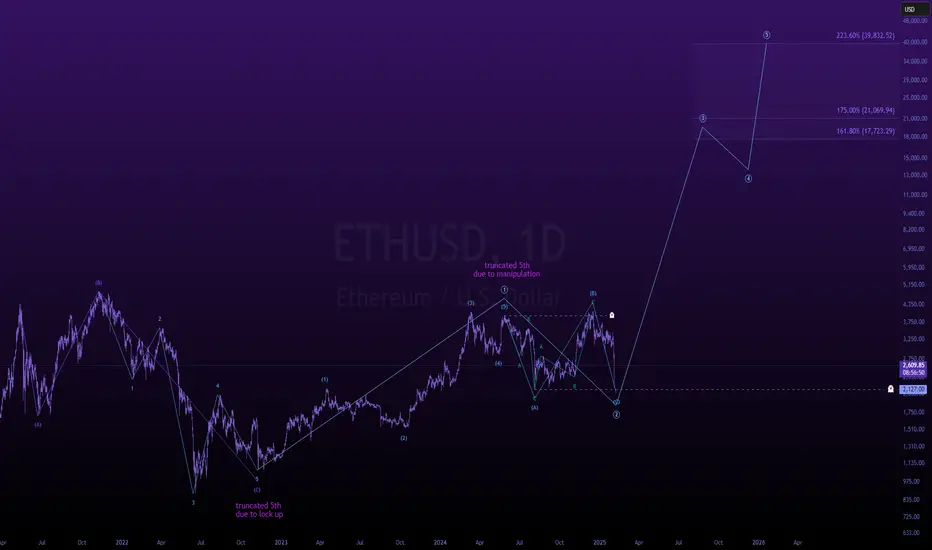
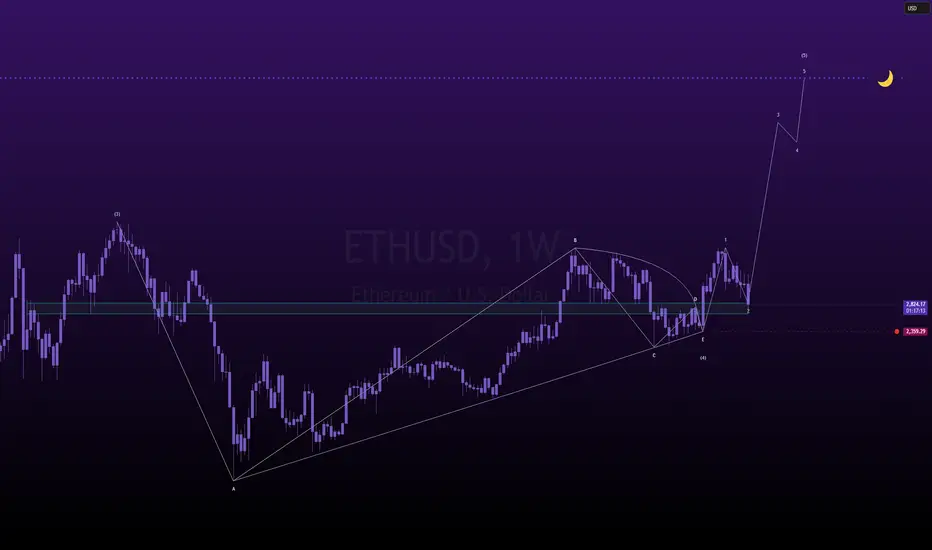
a l t s e a s o n b e g i n sread that title one more time anon,
and then again.
bookmark this post,
come back to it in a few months and tell me you made money,
or come back to it, and tell me how wrong i was.
either way,
this is the primary.
---
there is blood on the streets, so i come here on this eve' to share my perspective, to shed a little light on how i'm looking at this structure. i don't have to put this update out today, i really don't, but i'm doing it for you, the people. if i'm wrong, so be it, but if i'm right, donate a portion of your winnings to a charity and go live out the rest of your life away with a smile on your face.
---
my theory on ethereum is simple,
i'm labeling the entire move from november 2021 -> november of 2024 as a triangle.
for this triangle to work out, it is imperative for ethereum to stay above 2359.29 which is the hard invalidation on my idea.
sweep this low, and ethereum can see a liquidation down to $800, where the real trench will be discovered.
---
keep in mind, i am not a financial advisor, this is simply my best bullish take on a market which so many are fleeing from, during a time where alt season is on the verge of beginning.
🌙
ETH | Alternative Chart Pattern | EducationJust a short update for my latest C&H post
Price is also forming an Ascending Triangle pattern with a liquidity zone of $2,800 - $3,000 for an average spot for buyer to step in
When trading chart patterns it's best to figure out how to jump in before the breakout similarly to the last touches highlighted in blue on the bottom trendline
You can see that price was forming a bottom-like pattern or what I also like to call price accumulation and then vice versa for the tops.

EHTUSD is Still Running ShortETHUSD broker the regression channel about two weeks ago and failed to move into a long bias since then.
Support is now getting close - let's see how price action develops.
