Ethereum H4 | Falling toward a pullback supportEthereum (ETH/USD) is falling towards a pullback support and could potentially bounce off this level to climb higher.
Buy entry is at 1,674.75 which is a pullback support that aligns close to the 38.2% Fibonacci retracement.
Stop loss is at 1,520.00 which is a level that lies underneath a multi-swing-low support and the 61.8% Fibonacci retracement.
Take profit is at 1,913.15 which is a swing-high resistance.
High Risk Investment Warning
Trading Forex/CFDs on margin carries a high level of risk and may not be suitable for all investors. Leverage can work against you.
Stratos Markets Limited (tradu.com):
CFDs are complex instruments and come with a high risk of losing money rapidly due to leverage. 63% of retail investor accounts lose money when trading CFDs with this provider. You should consider whether you understand how CFDs work and whether you can afford to take the high risk of losing your money.
Stratos Europe Ltd (tradu.com):
CFDs are complex instruments and come with a high risk of losing money rapidly due to leverage. 63% of retail investor accounts lose money when trading CFDs with this provider. You should consider whether you understand how CFDs work and whether you can afford to take the high risk of losing your money.
Stratos Global LLC (tradu.com):
Losses can exceed deposits.
Please be advised that the information presented on TradingView is provided to Tradu (‘Company’, ‘we’) by a third-party provider (‘TFA Global Pte Ltd’). Please be reminded that you are solely responsible for the trading decisions on your account. There is a very high degree of risk involved in trading. Any information and/or content is intended entirely for research, educational and informational purposes only and does not constitute investment or consultation advice or investment strategy. The information is not tailored to the investment needs of any specific person and therefore does not involve a consideration of any of the investment objectives, financial situation or needs of any viewer that may receive it. Kindly also note that past performance is not a reliable indicator of future results. Actual results may differ materially from those anticipated in forward-looking or past performance statements. We assume no liability as to the accuracy or completeness of any of the information and/or content provided herein and the Company cannot be held responsible for any omission, mistake nor for any loss or damage including without limitation to any loss of profit which may arise from reliance on any information supplied by TFA Global Pte Ltd.
The speaker(s) is neither an employee, agent nor representative of Tradu and is therefore acting independently. The opinions given are their own, constitute general market commentary, and do not constitute the opinion or advice of Tradu or any form of personal or investment advice. Tradu neither endorses nor guarantees offerings of third-party speakers, nor is Tradu responsible for the content, veracity or opinions of third-party speakers, presenters or participants.
ETHBULLUSD trade ideas

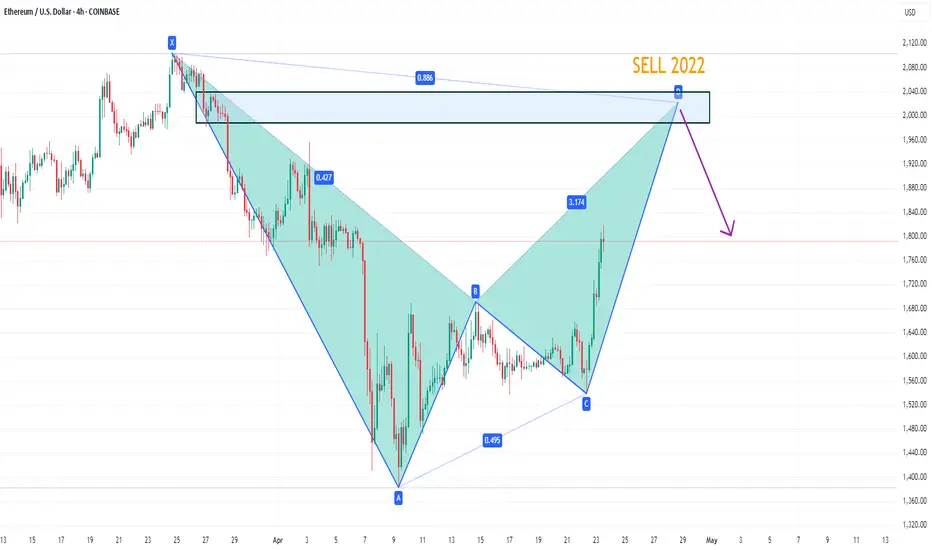
ETHUSD potential bearish bat patternOn the 4-hour chart, ETHUSD stabilized and rebounded. The current upper resistance is around 2022. Once it reaches that level, pay attention to the potential bearish bat pattern. At the same time, this position is in the previous supply area.
Ethereum (ETH) Buy Trade Setup 23/04/2025 09:08 AMEthereum (ETH) Buy Trade Setup
Entry: $1772
Target: $1860
Stop Loss: $1735
Risk-Reward Ratio: ≈ 2.38:1
🔔 Disclaimer:
This is not financial advice. The trade setup provided is for educational and informational purposes only. Always do your own research and consider your risk tolerance before entering any trade. Cryptocurrency markets are volatile and past performance is not indicative of future results. Trade at your own risk.


ETH Tests The $1,623 Level as SupportFenzoFx—ETH rebounded at the $1,623 support level, indicating potential for an uptrend toward $1,755.
If ETH/USD drops below $1,623, it may test the 50-period SMA near $1,600, aligned with the 50% Fibonacci retracement.
>>> No Deposit Bonus
>>> %100 Deposit Bonus
>>> Forex Analysis Contest
All at FenzoFx Decentralized Forex Broker

ETH/USD... Ethereum 1day chart pattern.✨ ETHUSD Trade Setup
Technical Analysis: Ethereum (ETH) has broken out of the descending channel, signaling a potential trend reversal. The MACD is showing bullish momentum, supporting a Buy signal.
Entry: 1,600
Targets:
Target 1: 2,100
Target 2: 2,800
Stop Loss: 1,399
Bias: Bullish
Confirmation: Channel breakout + MACD bullish crossover
---
Let me know if you want a chart image, a version for social media, or to track this trade over time.

$ETH Is Trapped in Bearsh Channel — Breakout Coming or More PainWhile Bitcoin has been stealing the spotlight, Ethereum ( CRYPTOCAP:ETH ) is quietly stuck in a bearish channel on the daily chart.
📉 Lower highs. Lower lows.
Price is respecting both the upper and lower bounds with precision.
🔍 What’s happening:
• Since December when price topped at $4,125 CRYPTOCAP:ETH started it's bearish move
• Volume is thinning = indecision
• ETH/BTC pair is underperforming
📊 Things to watch:
• A strong breakout above $1,790 with volume could flip the narrative
• Otherwise, we may go back to $1,400 or even current channel support at $1,000
Are you positioning for a breakout or shorting the range?
⚔️ Drop your ETH bias + chart if you have one. Let’s compare setups 👇

ETH buy tradeLooking for buy trade in eth once price moves to fvg and reverses in ltf with condirmationj bos

ETHUSD: Strong Bearish Sentiment! Short!
My dear friends,
Today we will analyse ETHUSD together☺️
The price is near a wide key level
and the pair is approaching a significant decision level of 1.576.0 Therefore, a strong bearish reaction here could determine the next move down.We will watch for a confirmation candle, and then target the next key level of 1.557.1..Recommend Stop-loss is beyond the current level.
❤️Sending you lots of Love and Hugs❤️

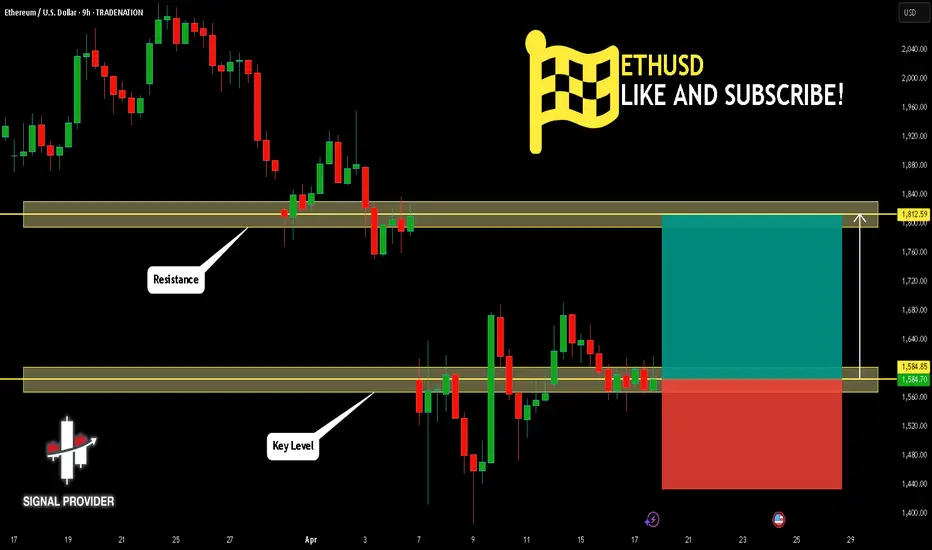
ETHUSD Will Go Higher! Buy!
Take a look at our analysis for ETHUSD.
Time Frame: 9h
Current Trend: Bullish
Sentiment: Oversold (based on 7-period RSI)
Forecast: Bullish
The market is testing a major horizontal structure 1,584.85.
Taking into consideration the structure & trend analysis, I believe that the market will reach 1,812.59 level soon.
P.S
The term oversold refers to a condition where an asset has traded lower in price and has the potential for a price bounce.
Overbought refers to market scenarios where the instrument is traded considerably higher than its fair value. Overvaluation is caused by market sentiments when there is positive news.
Disclosure: I am part of Trade Nation's Influencer program and receive a monthly fee for using their TradingView charts in my analysis.
Like and subscribe and comment my ideas if you enjoy them!
ETH Bullish trend change.After a very unexpected bearish ride for ETH, I am convinced we are having
a trend change to the upside for ETH. A bullish move to the upside
can happen quickly and make new highs.
Trade at own risk.. !

ETH Bottom soonEth never hit the ritualistic new ATH for the bull run cycle leading many to believe it is next in line to break its previous ATH to the upside of 4700.
However, given the current U.S. presidents reputation to do everything hard, and ETH's involvement with central banks, we are potentially due for a hard lading dip and rip scenario for ETH before it hits a new ATH. Here is the support arc I speculate to load up, and don't forget, double and triple bottoms make it more real.

Ethereum Trades Sideways Testing Critical Support FenzoFx—Ethereum trades sideways, unable to surpass $1,690 resistance. Currently, it hovers at $1,565, testing this level as support.
The bearish trend persists below $1,755. Stabilization under $1,565 may lead to dips toward $1,470 and potentially $1,370 if selling pressure increases.
>>> No Deposit Bonus
>>> %100 Deposit Bonus
>>> Forex Analysis Contest
All at F enzo F x Decentralized Forex Broker

EthereumETHUSD
- Bearish Channel as an Corrective Pattern in Short Time Frame
- Resistance Level
- Break of Structure
- Completed " 12345 " Impulsive Waves and " A " Corrective Waves
- Ascending Triangle

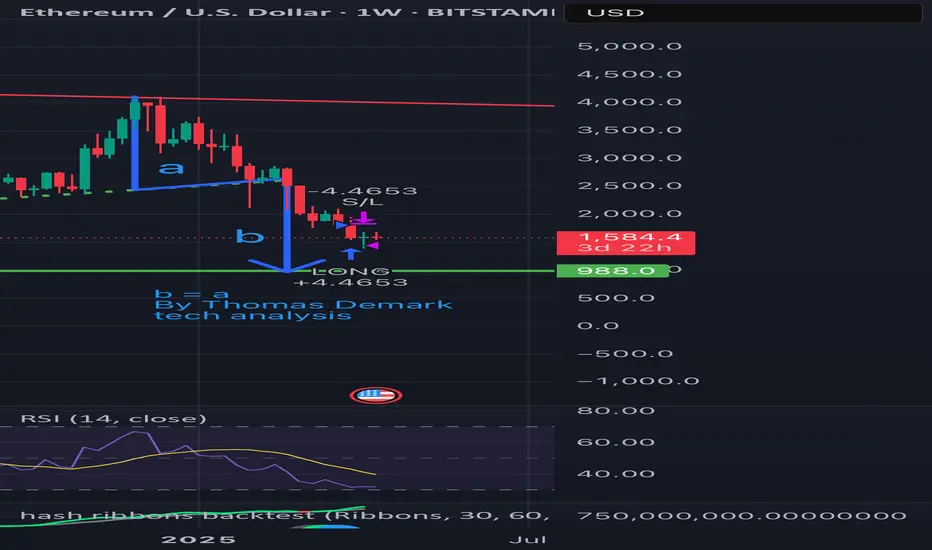
ETH is falling per Demark’s technical analysis: Target at $988?According to Thomas Demark’s method — when b = a, the next target for ETH is around $988.
📉 Price broke the ascending support
🔻 Wave “a” from $4000 to $2500 has already played out
📏 Wave “b” is projected downward — target aligns with a strong historical support zone
📊 Weekly RSI is nearing oversold territory
Conclusion: The $988 area is critical. A reversal may occur there if selling pressure weakens.
Stay sharp.
#ETH #Demark #CryptoAnalysis #TechnicalAnalysis #Ethereum
Ethereum H4 | Potential bearish reversalEthereum (ETH/USD) could rise towards a multi-swing-high resistance and potentially reverse off this level to drop lower.
Sell entry is at 1,674.75 which is a multi-swing-high resistance.
Stop loss is at 1,770.00 which is a level that sits above the 50.0% Fibonacci retracement and a pullback resistance.
Take profit is at 1,399.55 which is a multi-swing-low support.
High Risk Investment Warning
Trading Forex/CFDs on margin carries a high level of risk and may not be suitable for all investors. Leverage can work against you.
Stratos Markets Limited (tradu.com):
CFDs are complex instruments and come with a high risk of losing money rapidly due to leverage. 63% of retail investor accounts lose money when trading CFDs with this provider. You should consider whether you understand how CFDs work and whether you can afford to take the high risk of losing your money.
Stratos Europe Ltd (tradu.com):
CFDs are complex instruments and come with a high risk of losing money rapidly due to leverage. 63% of retail investor accounts lose money when trading CFDs with this provider. You should consider whether you understand how CFDs work and whether you can afford to take the high risk of losing your money.
Stratos Global LLC (tradu.com):
Losses can exceed deposits.
Please be advised that the information presented on TradingView is provided to Tradu (‘Company’, ‘we’) by a third-party provider (‘TFA Global Pte Ltd’). Please be reminded that you are solely responsible for the trading decisions on your account. There is a very high degree of risk involved in trading. Any information and/or content is intended entirely for research, educational and informational purposes only and does not constitute investment or consultation advice or investment strategy. The information is not tailored to the investment needs of any specific person and therefore does not involve a consideration of any of the investment objectives, financial situation or needs of any viewer that may receive it. Kindly also note that past performance is not a reliable indicator of future results. Actual results may differ materially from those anticipated in forward-looking or past performance statements. We assume no liability as to the accuracy or completeness of any of the information and/or content provided herein and the Company cannot be held responsible for any omission, mistake nor for any loss or damage including without limitation to any loss of profit which may arise from reliance on any information supplied by TFA Global Pte Ltd.
The speaker(s) is neither an employee, agent nor representative of Tradu and is therefore acting independently. The opinions given are their own, constitute general market commentary, and do not constitute the opinion or advice of Tradu or any form of personal or investment advice. Tradu neither endorses nor guarantees offerings of third-party speakers, nor is Tradu responsible for the content, veracity or opinions of third-party speakers, presenters or participants.

ETHUSD INTRADAY falling resistance retest at 1,724The ETH/USD pair is exhibiting a bearish sentiment, reinforced by the ongoing downtrend. The key trading level to watch is at 1,724, which represents the current intraday swing high and the falling resistance trendline level.
In the short term, an oversold rally from current levels, followed by a bearish rejection at the 1,724 resistance, could lead to a downside move targeting support at 1,409, with further potential declines to 1,350 and 1,265 over a longer timeframe.
On the other hand, a confirmed breakout above the 1,724 resistance level and a daily close above that mark would invalidate the bearish outlook. This scenario could pave the way for a continuation of the rally, aiming to retest the 1,840 resistance, with a potential extension to 1,926 levels.
Conclusion:
Currently, the ETH/USD sentiment remains bearish, with the 1,724 level acting as a pivotal resistance. Traders should watch for either a bearish rejection at this level or a breakout and daily close above it to determine the next directional move. Caution is advised until the price action confirms a clear break or rejection.
This communication is for informational purposes only and should not be viewed as any form of recommendation as to a particular course of action or as investment advice. It is not intended as an offer or solicitation for the purchase or sale of any financial instrument or as an official confirmation of any transaction. Opinions, estimates and assumptions expressed herein are made as of the date of this communication and are subject to change without notice. This communication has been prepared based upon information, including market prices, data and other information, believed to be reliable; however, Trade Nation does not warrant its completeness or accuracy. All market prices and market data contained in or attached to this communication are indicative and subject to change without notice.

ETH/USD 1H PAIREthereum has formed a rising wedge or ascending triangle pattern, typically a bearish formation when it appears after an uptrend. After testing the horizontal resistance zone (~$1,685) multiple times, price action failed to break out and instead broke below the ascending trendline support, confirming a bearish reversal.
Breakdown Confirmation:
Price broke down from the key structure and also fell below the consolidation range (orange box).
The breakdown was accompanied by increased momentum, suggesting strong seller pressure
Short-Term Bearish Outlook:
1st Target: $1,580
Previous consolidation and minor support level.
Short-term take-profit zone for intraday or swing positions
Expect minor bounce or hesitation here.
2nd Target: $1,480
Full measured move target based on triangle height.
Strong historical support and Fibonacci confluence zone.
Ideal for full profit booking or watching for a potential reversal.

Short-term trade for ETHEREUM with RR of 1:2.6Short term trade for ETHEREUM with RR of 1:2.6
Following the recovery from the recent dip, this is a short-term trade.
Entry: $1,640
Stop Loss: $1,632
Take profit: $1,660
Trade with care

ETHUSD 1H chart pattrenMY buy position on ETH/USD at 1,670 with targets at 1,760 and 1,850 looks promising. Let's dive into some key factors to consider:
Technical Indicators
1. RSI (Relative Strength Index): Check if ETH is oversold or overbought. An RSI below 30 might indicate a buying opportunity, while above 70 could suggest it's overbought.
2. MACD (Moving Average Convergence Divergence): A
bullish crossover (MACD line crossing above the signal line) could support your buy position.
3. Support/Resistance Levels: Identify key support levels
around 1,670. If there's strong support, it could bounce back up. Resistance levels near 1,760 and 1,850 might pose challenges.
Market Sentiment
1. News and Trends: Keep an eye on crypto market
news, regulatory announcements, and technological developments that could impact ETH's price.
2. Broader Market Conditions: The overall crypto market
sentiment can influence ETH's price. A bullish trend in Bitcoin often lifts other cryptocurrencies.
Risk Management
1. Stop-Loss Orders: Set a stop-loss below a significant
support level to limit potential losses. This could be around 1,600 or lower, depending on the current support levels.
2. Position Sizing: Ensure you're not risking more than
you can afford to lose on this trade. Consider your overall portfolio and risk tolerance.
3. Diversification: Make sure your portfolio is diversified to mitigate risks associated with crypto volatility.
Additional Considerations
1. Volume: Check the trading volume. Higher volume can validate the strength of the price movement.
2. Trend Lines: Identify any trend lines that might
3.
influence the price. A break above a downward trend line could signal a reversal.
Next Steps
Analyze Charts: Take a closer look at the ETH/USD charts on different time frames (1-hour, 4-hour, daily) to identify patterns and key levels.
Stay Updated: Keep up with market news and technical analysis to adjust your strategy as needed.
Review Risk Management: Regularly review your stop-loss and take-profit levels based on market conditions.
Would you like to explore specific technical indicators or discuss potential scenarios based on market news?

ETH Gameplan for the rest of the year?Assuming the markets take a breather and crypto also finds a bid, I'd see this possible scenario. The ugly stuff first, the death cross has already happened, ETH is in a downtrend with not much air to breathe. A falling wedge has formed that could break to the upside.
If the market has legs and doesn't correct further for a while, then I would see a relief rally in equities. If the FED cuts rates in May, I'd expect a continuation over the summer.
Still, I'd expect ETH to top out at around $2,400 (very optimistic) and bottom out at around $1,100 in winter/early 2026.


Ethereum – Short-Term Bearish Outlook as Resistance HoldsEthereum's recent attempt to break above the short-term resistance zone around $1,671 was once again rejected, highlighting ongoing selling pressure and a possible continuation of the downward trajectory—at least in the short term. The current 4H chart setup is showing strong resistance confirmation, which strengthens our conviction that bears remain in control, with a near-term downside target clearly visible.
Price Action and Key Technicals
Looking at the ETH/USD 4-hour chart (April 14, 2025), we observe a consistent failure to break and sustain above the $1,671 resistance. This price zone has acted as a major supply zone in the current cycle, and the recent wick rejections at this level reinforce the case for continued selling pressure.
Price is currently trading around $1,640, holding just below the failed resistance. Given the clear rejection, Ethereum remains vulnerable to another leg lower, particularly as no bullish follow-through has materialized in recent sessions.
The next major level to watch on the downside is $1,567.5, which has served as local support in recent candles. However, our primary profit target remains at $1,457, a price area which has historically attracted demand and marked local bottoms.
On the upside, the stop-loss for this setup is placed above the $1,780.4 level—beyond the previous structural high—to provide adequate room for volatility while still protecting against a trend reversal.
Bearish Setup Summary
Sell Zone: Near current price levels ($1,640 - $1,665)
Key Resistance (invalidates bearish bias): $1,671
Stop Loss: $1,780.4
Take Profit (Primary Target): $1,457
Short-Term Outlook: Bearish
Conviction: Moderate-to-High
While the bearish case currently holds sway, it’s important to stress that this conviction is short-term. Given the broader context of Ethereum’s market cycle and macro crypto sentiment, we could be approaching the end of the current corrective phase. Therefore, this forecast is more tactical than structural, and it will require dynamic re-evaluation once the $1,457 zone is reached or invalidated.
