Ethereum Price Analysis: Range-bound with Potential Buy ZoneEthereum's price action remains within a defined range, recently moving from the top toward the lower boundary. A similar setup is observed in the ETH/BTC pair. This area may offer a buying opportunity, though confirmation of an uptrend on the daily chart is still required.
ETHBULLUSD trade ideas

(ETH) ethereum one day chart,. I confused the week chart setting for the day and found more optimism than there truly is. Still the line are converging and separating and creating time as a chart to distance oneself from reality only to get lost in the timeframes of trade.

(ETH) ethereum "triangle - slant"Ethereum is not priced for an only up direction as of right now, unlike Bitcoin. As seen in the chart and indicator. The pink and purple dotted lines are close to intersecting and if the pink link crosses over this is a good sign for the chance of a neutrality and even a possible upward forming price chart position.

Ethereum H4 | Heading into a pullback resistanceEthereum (ETH/USD) is rising towards a pullback resistance and could potentially reverse off this level to drop lower.
Sell entry is at 1,746.35 which is a pullback resistance that aligns with the 50.0% Fibonacci retracement.
Stop loss is at 1,980.00 which is a level that sits above the 78.6% Fibonacci retracement and an overlap resistance.
Take profit is at 1,436.95 which is a swing-low support.
High Risk Investment Warning
Trading Forex/CFDs on margin carries a high level of risk and may not be suitable for all investors. Leverage can work against you.
Stratos Markets Limited (tradu.com):
CFDs are complex instruments and come with a high risk of losing money rapidly due to leverage. 63% of retail investor accounts lose money when trading CFDs with this provider. You should consider whether you understand how CFDs work and whether you can afford to take the high risk of losing your money.
Stratos Europe Ltd (tradu.com):
CFDs are complex instruments and come with a high risk of losing money rapidly due to leverage. 63% of retail investor accounts lose money when trading CFDs with this provider. You should consider whether you understand how CFDs work and whether you can afford to take the high risk of losing your money.
Stratos Global LLC (tradu.com):
Losses can exceed deposits.
Please be advised that the information presented on TradingView is provided to Tradu (‘Company’, ‘we’) by a third-party provider (‘TFA Global Pte Ltd’). Please be reminded that you are solely responsible for the trading decisions on your account. There is a very high degree of risk involved in trading. Any information and/or content is intended entirely for research, educational and informational purposes only and does not constitute investment or consultation advice or investment strategy. The information is not tailored to the investment needs of any specific person and therefore does not involve a consideration of any of the investment objectives, financial situation or needs of any viewer that may receive it. Kindly also note that past performance is not a reliable indicator of future results. Actual results may differ materially from those anticipated in forward-looking or past performance statements. We assume no liability as to the accuracy or completeness of any of the information and/or content provided herein and the Company cannot be held responsible for any omission, mistake nor for any loss or damage including without limitation to any loss of profit which may arise from reliance on any information supplied by TFA Global Pte Ltd.
The speaker(s) is neither an employee, agent nor representative of Tradu and is therefore acting independently. The opinions given are their own, constitute general market commentary, and do not constitute the opinion or advice of Tradu or any form of personal or investment advice. Tradu neither endorses nor guarantees offerings of third-party speakers, nor is Tradu responsible for the content, veracity or opinions of third-party speakers, presenters or participants.

ETH/USD Analysis - Consolidation with Potential BreakoutETH/USD is currently in a consolidation phase on the 1-hour chart, trading within a range between $1,602.5 (resistance) and $1,595 (support). The price has shown multiple tests of these levels, with recent long and short signals indicating potential breakout opportunities.
Technical Indicators:
This analysis uses the " Supertrend with EMA and RSI @tradingbauhaus " indicator:
• Supertrend: The price is oscillating around the Supertrend line (green/red), with recent signals flipping between bullish (long) and bearish (short).
• EMA (10, 50): The price is near the 50-period EMA, acting as dynamic support/resistance. A breakout above or below could confirm the next move.
• RSI (14): Not visible on the chart, but typically used in this indicator to gauge overbought/oversold conditions.
Key Levels and Signals:
• Resistance: $1,602.5 (recent high, marked with a short signal at -6).
• Support: $1,595 (recent low, marked with a long signal at +6).
• Entry (Long): A confirmed break above $1,602.5 could signal a long entry, with a recent long signal at $1,610.
• Entry (Short): A break below $1,595 could confirm a short entry, as seen with the recent short signal at $1,602.5.
• Stop Loss (SL): For longs, place below $1,595; for shorts, place above $1,602.5.
• Take Profit (TP): For longs, target $1,620; for shorts, target $1,580.
Conclusion:
ETH/USD is at a critical juncture, with the price testing a tight range. A breakout above $1,602.5 could signal bullish momentum, while a drop below $1,595 might favor bears. Watch for confirmation from the Supertrend and EMA alignment. What are your thoughts, traders?

ETHUSD, 4Hr, Long SetupETHUSD, 4Hr, Long Setup
TE: 150~1550
SL:1350
TP: 1900
BUT its all dependent on BTC as its dominance is going high and alts can follow BTC trend as well
CHOH occured on 4Hr

Ethereum (ETH/USD) Technical Analysis – Daily Chart (D1)
Method: Smart Money Concepts (SMC)
Date: April 13, 2025
🔍 Market Structure Overview
Current trend: Bearish
The chart clearly shows a sequence of Breaks of Structure (BOS) to the downside, indicating strong bearish pressure.
The latest Change of Character (CHoCH) occurred in early February 2025, marking a shift from accumulation/distribution into a downward phase.
🧠 Smart Money Concepts Highlights
Break of Structure (BOS)
Multiple BOS levels broken to the downside, confirming institutional selling activity.
The most recent BOS around $1,700 now acts as a key resistance zone.
Change of Character (CHoCH)
A confirmed CHoCH to the downside reflects a structural shift in favor of sellers.
Equal Highs (EQH) & Weak Low
The EQH has already been taken, indicating liquidity sweep above prior highs.
The Weak Low near $1,360 now becomes a likely downside target for smart money.
🧱 Key Supply & Demand Zones
Supply Zones (Resistance):
$1,950 – $2,300
$2,650 – $2,850
$3,100 – $3,500 (major EQH + distribution zone)
Demand Zone:
$1,360 – $1,300 (Weak Low and liquidity pool)
📉 Swing Trading Plan (Bearish Bias)
🔻 Potential Short Setup
Entry Area (Sell on Rally):
Price retracing into the $1,720 – $1,800 area (minor supply zone + previous BOS level)
Entry Confirmation:
Look for signs of bearish intent on the H4 timeframe:
Swing Failure Pattern (SFP)
Minor BOS
Bearish engulfing
Take Profit Targets:
TP1: $1,360
TP2: $1,280
Stop Loss (SL):
Above $1,850 (invalidates the bearish structure)
🔄 Alternative Bullish Scenario
A clean breakout and hold above $1,850 could indicate a CHoCH to the upside, potentially signaling a medium-term bullish reversal. However, the current structure remains bearish until proven otherwise.
📌 Conclusion
Bias: Bearish while price remains below $1,800
Strategy: Sell on retracement into premium zone
Confirmation: Look for SFP, BOS, or bearish PA on H4
Target Levels: $1,360 – $1,280
For full breakdown and SMC swing strategies, search: KepoinTrading on Google

ETHUSDT BUYEthereum buy signal on M15 Timeframe, Bullish triangle resistance was succesfully broken. Now bullish target is 1689 level. Risk reward 1/3

ETHUSD | 12.04.2025BUY 1550.00 | STOP 1100.00 | TAKE 2150.00 | Ethereum against the US dollar is trading near the medium-term support level and the price has approached the important range of 1370.00 - 1150.00, from which we expect the price to start rising towards the value of 2150.00.

ETHUSD 1D OutlookWeekends are for trading crypto. This is what we have on the daily chart. A clear bearish trend has ETH on a strong chokehold. I am expecting some liquidity grab below before a pump up for today

ETHUSD INTRADAY capped by resistance at 1,724 The ETH/USD pair is exhibiting a bearish sentiment, reinforced by the ongoing downtrend. The key trading level to watch is at 1,724, which represents the current intraday swing high and the falling resistance trendline level.
In the short term, an oversold rally from current levels, followed by a bearish rejection at the 1,724 resistance, could lead to a downside move targeting support at 1,409, with further potential declines to 1,350 and 1,265 over a longer timeframe.
On the other hand, a confirmed breakout above the 1,724 resistance level and a daily close above that mark would invalidate the bearish outlook. This scenario could pave the way for a continuation of the rally, aiming to retest the 1,840 resistance, with a potential extension to 1,926 levels.
Conclusion:
Currently, the ETH/USD sentiment remains bearish, with the 1,724 level acting as a pivotal resistance. Traders should watch for either a bearish rejection at this level or a breakout and daily close above it to determine the next directional move. Caution is advised until the price action confirms a clear break or rejection.
This communication is for informational purposes only and should not be viewed as any form of recommendation as to a particular course of action or as investment advice. It is not intended as an offer or solicitation for the purchase or sale of any financial instrument or as an official confirmation of any transaction. Opinions, estimates and assumptions expressed herein are made as of the date of this communication and are subject to change without notice. This communication has been prepared based upon information, including market prices, data and other information, believed to be reliable; however, Trade Nation does not warrant its completeness or accuracy. All market prices and market data contained in or attached to this communication are indicative and subject to change without notice.

Buy the dip; but becarefulIts volatile inside 1560 area but please use proper risk ; it will get spikey during the trade war.
We should expect the fly back to the highs; if the resistance still strong then we will see further down; lets see what happens.

possible head and shoulders on ethpossible forming on the 4 hour looking for a brake above 1640. 00 to make h&s invalid
we are in abc correction and are in c wave going down to possible 1200.00 hold on

Bullish bounce?Ethereum (ETH/USD) has bounced off the pivot which has been identified as an overlap support and could rise to the 1st resistance which acts as a pullback resistance.
Pivot: 1,481.30
1st Support: 1,383.21
1st Resistance: 1,594.06
Risk Warning:
Trading Forex and CFDs carries a high level of risk to your capital and you should only trade with money you can afford to lose. Trading Forex and CFDs may not be suitable for all investors, so please ensure that you fully understand the risks involved and seek independent advice if necessary.
Disclaimer:
The above opinions given constitute general market commentary, and do not constitute the opinion or advice of IC Markets or any form of personal or investment advice.
Any opinions, news, research, analyses, prices, other information, or links to third-party sites contained on this website are provided on an "as-is" basis, are intended only to be informative, is not an advice nor a recommendation, nor research, or a record of our trading prices, or an offer of, or solicitation for a transaction in any financial instrument and thus should not be treated as such. The information provided does not involve any specific investment objectives, financial situation and needs of any specific person who may receive it. Please be aware, that past performance is not a reliable indicator of future performance and/or results. Past Performance or Forward-looking scenarios based upon the reasonable beliefs of the third-party provider are not a guarantee of future performance. Actual results may differ materially from those anticipated in forward-looking or past performance statements. IC Markets makes no representation or warranty and assumes no liability as to the accuracy or completeness of the information provided, nor any loss arising from any investment based on a recommendation, forecast or any information supplied by any third-party.

Warning: Low Ethereum Target LoomsThe Unthinkable Target: Is $1,000 ETH Really in Play?
Suggesting Ethereum could fall back to $1,000 might seem hyperbolic to those who remember its peak near $5,000. However, the crypto market is notorious for its brutal volatility and deep drawdowns. Bitcoin itself has experienced multiple corrections exceeding 80% from its all-time highs throughout its history. While Ethereum has matured significantly, it's not immune to severe market downturns or shifts in narrative dominance.
A $1,000 price target represents a roughly 65-70% decline from prices seen in early-to-mid 2024 (assuming a starting point around $3,000-$3,500) and an approximate 80% drop from its all-time high. While drastic, such a move could become plausible under a confluence of negative circumstances:
1. Severe Macroeconomic Downturn: A deep global recession, coupled with sustained high interest rates or a major credit event, could trigger a massive risk-off wave across all assets, hitting speculative investments like crypto particularly hard.
2. Regulatory Crackdown: Punitive regulations targeting DeFi, staking, or specific aspects of Ethereum's ecosystem could severely damage sentiment and utility.
3. Technological Stagnation or Failure: Major setbacks in Ethereum's scaling roadmap or the discovery of a critical vulnerability could erode confidence.
4. Sustained Loss of Narrative: If competing blockchains definitively capture the dominant narrative for innovation, speed, and cost-effectiveness, ETH could lose its premium valuation.
5. Technical Breakdown: A decisive break below key long-term support levels (like the previous cycle highs around $1,400 or psychological levels like $2,000) could trigger cascading liquidations and stop-loss orders, accelerating the decline towards lower supports, including the $1,000 vicinity which acted as significant resistance/support in previous cycles.
While not a base-case prediction for many, the $1,000 target serves as a stark reminder of the potential downside if the current negative pressures persist and intensify, particularly within a broader bear market context. The factors currently driving ETH's weakness provide fuel for this bearish contemplation.
Reason 1: The Underwhelming Arrival of Spot Ethereum ETFs
Following the monumental success of Spot Bitcoin ETFs in the US, which attracted tens of billions in net inflows within months of launch, expectations were sky-high for their Ethereum counterparts. The narrative was compelling: regulated, accessible vehicles would unlock a floodgate of institutional capital, mirroring Bitcoin's ETF-driven price surge.
However, the reality has been starkly different and deeply disappointing for ETH bulls. Since their launch, Spot Ethereum ETFs have witnessed tepid demand, characterized by weak inflows and, at times, even net outflows. The initial excitement quickly fizzled out, failing to provide the anticipated buying pressure.
Several factors contribute to this underwhelming debut:
• Pre-Launch Regulatory Uncertainty: The SEC's approval process for ETH ETFs was far less certain and more contentious than for Bitcoin. This lingering ambiguity, particularly around Ethereum's classification (commodity vs. security) and the handling of staking, may have made some large institutions cautious.
• Lack of Staking Yield: Unlike holding ETH directly or through certain other investment products, the approved US Spot ETH ETFs do not currently offer holders exposure to staking yields – a core component of Ethereum's tokenomics and a significant draw for long-term investors. This makes the ETF product inherently less attractive compared to direct ownership for yield-seeking capital.
• Existing Exposure Channels: Institutional players interested in Ethereum already had established avenues for gaining exposure, including futures markets (CME ETH futures), Grayscale's Ethereum Trust (ETHE, although less efficient pre-conversion), and direct custody solutions. The incremental demand unlocked by the spot ETFs may have been smaller than anticipated.
• Market Timing and Sentiment: The ETH ETFs launched into a more challenging macroeconomic environment and a period of cooling sentiment in the broader crypto market compared to the Bitcoin ETF launch window. The initial risk-on euphoria had faded, replaced by concerns about inflation, interest rates, and geopolitical tensions.
• "Sell the News" Event: As often happens in markets, the period leading up to the ETF approval saw significant price appreciation. The actual launch may have triggered profit-taking by traders who had bought in anticipation of the event.
The impact of these weak ETF flows is significant. It signals a lack of immediate, large-scale institutional appetite for ETH through this specific channel, removing a key bullish catalyst that many had banked on. It also contributes to negative market sentiment, reinforcing the narrative that Ethereum is currently out of favor compared to Bitcoin or other trending assets. Without this expected wave of ETF-driven buying, the price is more susceptible to selling pressure from other sources.
Reason 2: Derivatives Market Flashing Red - Low Interest, Negative Funding
The derivatives market, particularly perpetual futures, provides crucial insights into trader sentiment and positioning. Two key metrics are currently painting a bearish picture for Ethereum: Open Interest (OI) and Funding Rates.
• Low Open Interest (OI): Open Interest represents the total number of outstanding derivative contracts (longs and shorts) that have not been settled. While OI naturally fluctuates, consistently low OI relative to historical peaks or compared to Bitcoin's OI suggests a lack of strong conviction and reduced speculative interest in Ethereum. When traders are uncertain or bearish, they are less likely to open large, leveraged positions, leading to subdued OI. This indicates that fewer market participants are willing to bet aggressively on ETH's future price direction, especially on the long side.
• Negative Funding Rates: Funding rates are periodic payments exchanged between long and short position holders in perpetual futures contracts. They are designed to keep the futures price tethered to the underlying spot price.
o Positive Funding: When the futures price trades at a premium to spot (contango) and bullish sentiment dominates, longs typically pay shorts. This incentivizes shorting and disincentivizes longing, helping to pull the prices back together.
o Negative Funding: When the futures price trades at a discount to spot (backwardation) and bearish sentiment prevails, shorts pay longs. This indicates a higher demand for short positions (either speculative shorting or hedging long spot holdings). Consistently negative funding rates, as observed for ETH during periods of weakness, are a strong bearish signal. It means traders are actively paying a premium to maintain short exposure, reflecting widespread pessimism about the price outlook.
•
The combination of low Open Interest and negative Funding Rates creates a negative feedback loop. It shows reduced speculative appetite, a dominance of short positioning, and a lack of leveraged longs willing to drive the price higher. While extremely negative funding can sometimes precede a "short squeeze" (where rising prices force shorts to cover, accelerating the rally), the persistent nature of these conditions recently suggests underlying weakness rather than an imminent explosive reversal. This bearish derivatives landscape acts as a significant headwind, absorbing buying pressure and making sustained rallies difficult.
Reason 3: The Relentless Rise of Competing Layer-1s
Ethereum's primary value proposition has long been its status as the dominant, most secure, and most decentralized platform for smart contracts and decentralized applications (DApps). However, its reign is facing its most significant challenge yet from a growing cohort of alternative Layer-1 (L1) blockchains, often dubbed "ETH Killers."
While Ethereum still dominates in terms of Total Value Locked (TVL) in DeFi and overall network value, competing L1s like Solana, Avalanche, Cardano, and newer entrants are rapidly gaining ground in crucial areas of network activity:
• Transaction Throughput and Fees: Many competitors offer significantly higher transaction speeds (transactions per second) and dramatically lower fees compared to Ethereum's mainnet. While Ethereum's Layer-2 scaling solutions aim to address this, the user experience on some alternative L1s can feel faster and cheaper for certain applications, attracting users and developers.
• Active Users and Daily Transactions: Chains like Solana have, at times, surpassed Ethereum in metrics like daily active addresses and transaction counts, particularly fueled by specific niches like meme coins, high-frequency DeFi, or certain NFT projects. This indicates a migration of user activity seeking lower costs or specific functionalities.
• Developer Activity and Ecosystem Growth: While Ethereum retains a vast developer community, alternative L1s are aggressively courting developers with grants, simpler tooling (in some cases), and the allure of building on the "next big thing." This leads to vibrant DApp ecosystems growing outside of Ethereum.
• Technological Differentiation: Competitors often employ different consensus mechanisms (e.g., Proof-of-History, Avalanche Consensus) or architectural designs that offer trade-offs favoring speed or specific use cases over Ethereum's current approach (though Ethereum's roadmap aims to incorporate many advancements).
The impact of this intensifying competition is multifaceted. It fragments liquidity and user attention across multiple platforms. It challenges the narrative of Ethereum's unassailable network effect. Crucially, it reduces the relative demand for ETH itself, which is needed for gas fees and staking on the Ethereum network. If users and developers increasingly opt for alternative platforms, the fundamental demand drivers for ETH weaken, putting downward pressure on its price relative to these competitors and the market overall. Ethereum is no longer the only viable option for building or using decentralized applications, and this increased competition is clearly impacting its market position and price performance.
The Path to Reversal: What Needs to Change for Ethereum?
Despite the current headwinds and the looming shadow of lower price targets, Ethereum is far from dead. It possesses a resilient community, the largest developer base, significant first-mover advantages, and a comprehensive roadmap for future upgrades. However, a sustainable trend reversal requires tangible progress and shifts across several fronts:
1. ETF Flows Must Materialize: The narrative needs to shift from disappointment to tangible success. This requires sustained, significant net inflows into the Spot ETH ETFs, potentially driven by broader institutional adoption, clearer regulatory frameworks globally, or perhaps future ETF iterations that incorporate staking yields (though regulatory hurdles for this are high).
2. Derivatives Sentiment Needs to Flip: Open Interest needs to build substantially, indicating renewed speculative conviction. More importantly, funding rates need to turn consistently positive, signaling a shift towards bullish positioning and leveraged longs re-entering the market.
3. Successful Execution of Ethereum's Roadmap: Continued progress and successful implementation of Ethereum's scaling solutions are paramount. Wider adoption and tangible impact from upgrades like Proto-Danksharding (EIP-4844) reducing Layer-2 fees, and clear progress towards future milestones like Verkle Trees and Statelessness, are needed to demonstrate Ethereum can overcome its scalability challenges and maintain its technological edge.
4. Reigniting Network Activity and Demand: Ethereum needs compelling new applications or upgrades to existing protocols that drive genuine user demand and increase the consumption of ETH for gas. This could come from innovations in DeFi, NFTs, GameFi, decentralized identity, or other unforeseen areas. The narrative needs to shift back towards Ethereum as the primary hub of valuable on-chain activity.
5. Favorable Macroeconomic Conditions: Like all risk assets, Ethereum would benefit significantly from a broader shift towards risk-on sentiment, potentially fueled by central bank easing (lower interest rates), controlled inflation, and stable global growth.
6. A Renewed, Compelling Narrative: Ethereum needs a clear and powerful story that resonates beyond its existing user base. Whether it's focusing on its superior security and decentralization, its role as the foundational "settlement layer" for the digital economy, or a new killer application, a refreshed narrative is needed to recapture investor imagination and justify a premium valuation.
Conclusion: Ethereum at a Critical Juncture
Ethereum's recent price struggles are not arbitrary; they are rooted in tangible factors: the lackluster performance of its spot ETFs, bearish signals from the derivatives market, and the undeniable pressure from faster, cheaper Layer-1 competitors. These elements combine to create an environment where contemplating a fall towards $1,000, while bearish, is a reflection of the significant challenges the network faces.
However, Ethereum's history is one of resilience and adaptation. It has weathered bear markets, technical hurdles, and competitive threats before. The path back to sustained growth and potentially new all-time highs is challenging but not impossible. It hinges on reigniting institutional interest via ETFs, flipping derivatives sentiment, successfully executing its ambitious technological roadmap to counter competitors, and benefiting from a supportive macro environment. Until these positive catalysts materialize convincingly, Ethereum may continue to lag, and the possibility of further downside, even towards the $1,000 mark in a severe downturn, will remain a topic of discussion among market participants navigating the crypto giant's uncertain future.

ETH Long Term Prediction - Ethereum Game Plan ETH broke the bullish weekly structure and is currently retracing lower. I don’t see any signs of strength on the chart yet.
I expect the price to first hit $1250 and see a rejection there a possible bounce.
However, the real target is $870 (2022 low). That level holds significant liquidity, so I expect it to be taken out, triggering a potential capitulation. I’ll be looking for spot buys and long-term long setups in anticipation of another possible bull run.

Ethereum is Under PressureFenzoFx—Ethereum has lost 4.5% of its value today, erasing gains from the previous trading day. The immediate resistance level is $1,755, in conjunction with the 50-period SMA. The downtrend will likely resume if this level holds, targeting the previous lower lows at $1,370.
Please note that the bearish outlook should be invalidated if ETH/USD exceeds $1,755. If this scenario unfolds, the price may target $1,950.
>>> Trade ETH/USD swap free at FenzoFx Decentralized Broker.

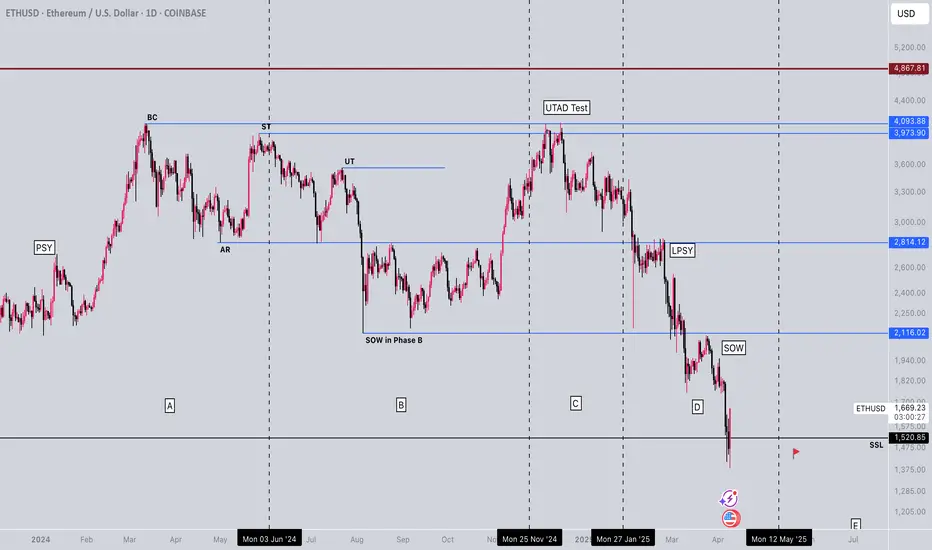
ETH just completed its Wyckoff Distribution EventContext:
PSY—preliminary supply, where large interests begin to unload shares in quantity after a pronounced up-move. Volume expands and price spread widens, signaling that a change in trend may be approaching.
BC—buying climax, during which there are often marked increases in volume and price spread. The force of buying reaches a climax, with heavy or urgent buying by the public being filled by professional interests at prices near a top. A BC often coincides with a great earnings report or other good news, since the large operators require huge demand from the public to sell their shares without depressing the stock price.
AR—automatic reaction. With intense buying substantially diminished after the BC and heavy supply continuing, an AR takes place. The low of this selloff helps define the lower boundary of the distribution TR.
ST—secondary test, in which price revisits the area of the BC to test the demand/supply balance at these price levels. For a top to be confirmed, supply must outweigh demand; volume and spread should thus decrease as price approaches the resistance area of the BC. An ST may take the form of an upthrust (UT), in which price moves above the resistance represented by the BC and possibly other STs before quickly reversing to close below resistance. After a UT, price often tests the lower boundary of the TR.
SOW—sign of weakness, observable as a down-move to (or slightly past) the lower boundary of the TR, usually occurring on increased spread and volume. The AR and the initial SOW(s) indicate a change of character in the price action of the stock: supply is now dominant.
LPSY—last point of supply. After testing support on a SOW, a feeble rally on narrow spread shows that the market is having considerable difficulty advancing. This inability to rally may be due to weak demand, substantial supply or both. LPSYs represent exhaustion of demand and the last waves of large operators’ distribution before markdown begins in earnest.
UTAD—upthrust after distribution. A UTAD is the distributional counterpart to the spring and terminal shakeout in the accumulation TR. It occurs in the latter stages of the TR and provides a definitive test of new demand after a breakout above TR resistance. Analogous to springs and shakeouts, a UTAD is not a required structural element: the TR in Distribution Schematic #1 contains a UTAD, while the TR in Distribution Schematic #2 does not.
ETHUSDT UpdateETHUSDT broke the High on 1hr time frame, we can take enter from this buy zone and ride with targets on $3500.
Note: It's Swing- Long Term Trade

After big dip later I will grow up with ETHI will go high little bit but be careful after yesterday hit SL

Daily descending wedge on ETH suggests bullish future aheadThis is a bullish pattern, so there's a hope and expectation the price will rise if and when we break up out of it. Price falling down out of this pattern would be exceptionally bearish.

1W ETHUSD: Rising wedge, tread carefully at end of yearAs above.
Rising wedge present on 1W has a ~60% chance of a bearish break once it violates the bottom trend line. Potential targets if this bearish pattern occurs is ~$1300, $1000, and back to $900 low.
Will follow.
Good luck traders.

