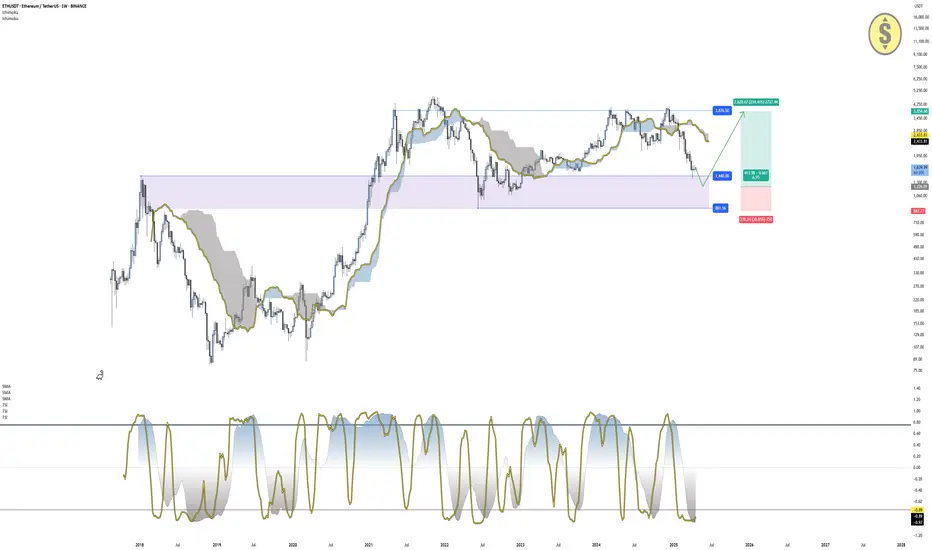
#ETHUSDT: Price to Touch All Time High $4500 By End Of YearETHUSDT has hit lowest point and we might see a price reversal towards $4500, which would be an all-time high. There are three potential targets for the price to reach.
Good luck and trade safely!
Best regards,
Team Setupsfx_
We’d love for you to support and encourage us!
- Like our ideas
- Share your thoughts
- Share our work if it helps
ETHBULLUSDT trade ideas

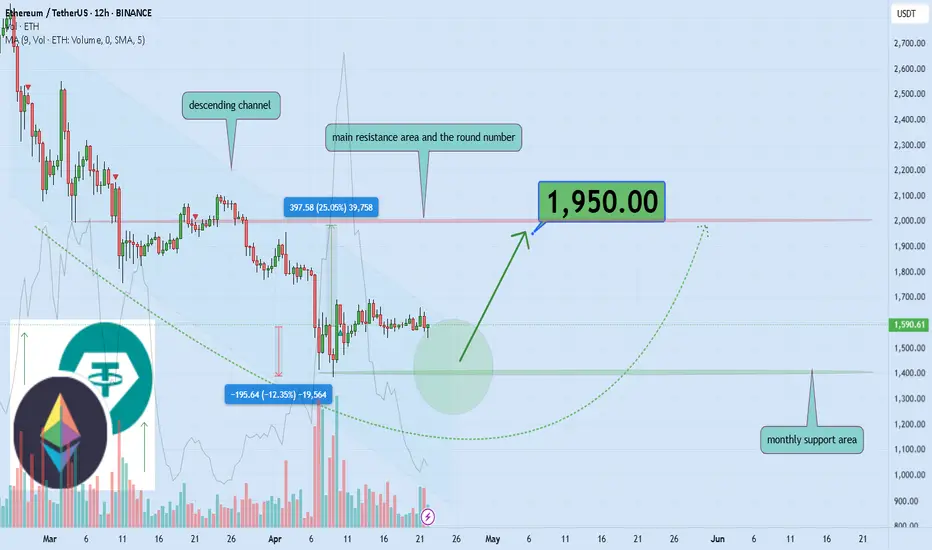
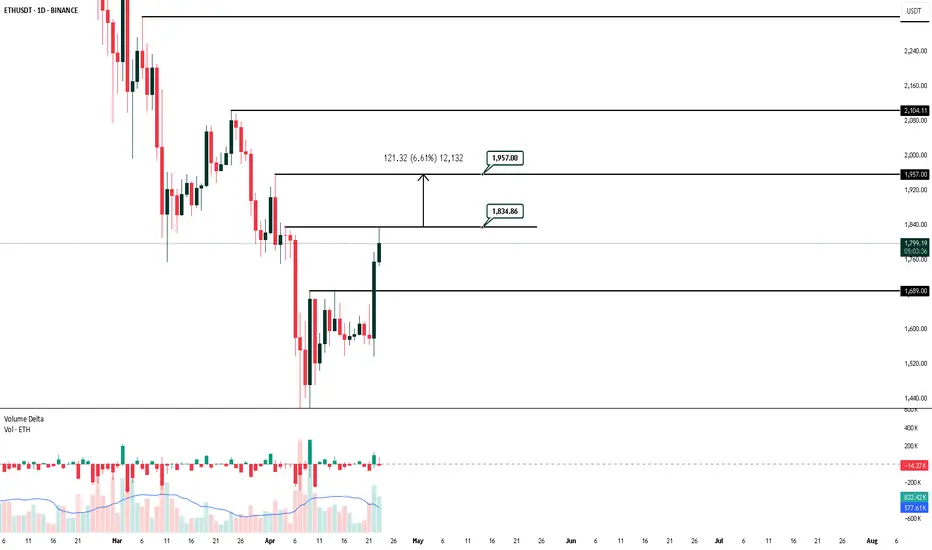
Ethereum Nears Breakout: Strong Support, $1950 Targeted NextHello and greetings to all the crypto enthusiasts, ✌
All previous targets were nailed ✅! Now, let’s dive into a full analysis of the upcoming price potential for Ethereum 🔍📈.
Ethereum has been trading within a downward cycle, but a short-term breakout above the descending channel appears likely. The price is approaching the key psychological level of $2,000, with a primary target of $1,950. This suggests a potential upside of at least 25% from a strong support zone.📚🙌
🧨 Our team's main opinion is: 🧨
Ethereum looks set to break out of its downtrend, eyeing the $2,000 mark with a main target of $1,950—about a 25% move up from strong support.📚🎇
Give me some energy !!
✨We invest hours crafting valuable ideas, and your support means everything—feel free to ask questions in the comments! 😊💬
Cheers, Mad Whale. 🐋
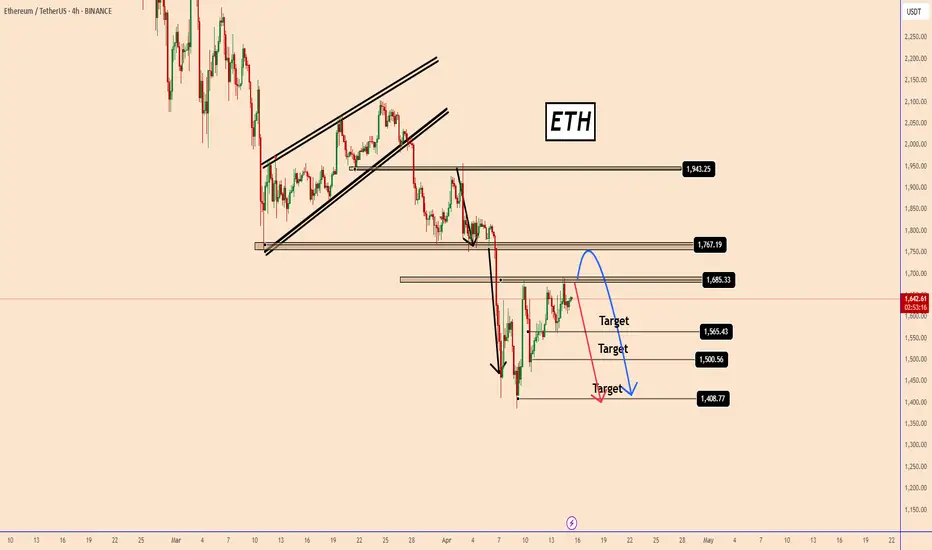
ETH Faces Strong Resistance—Bearish Trend Likely to Continue ETH Faces Strong Resistance—Bearish Trend Likely to Continue
ETH has struggled twice to break above the 1685 resistance level, keeping the price in a downward trend.
So far, the bearish momentum remains strong.
While there could be a slight recovery near 1615 due to low trading activity, a big price increase seems unlikely.
Another bearish wave may follow, with potential downside targets at 1500 and 1410, as shown in the chart.
You may find more details in the chart!
Thank you and Good Luck!
❤️PS: Please support with a like or comment if you find this analysis useful for your trading day❤️

Ethereum 8X Leveraged Trade OpportunityIf you want to make it big really fast, there is still one last chance to get ETHUSDT with a great entry price and high lev.
The chart setup is good. The market is good and everything is great.
Market conditions are only improving and the Altcoins are starting to heat up.
Right now, you see $1,600 but tomorrow the price can be $1,800 or more, that's how the Altcoins work. One day everything is quiet, the next day everything blows up. By the time the action is in, it is too late to buy, but not now, there is still one final chance to get bottom prices before the 2025 bull market shows up in full force.
Here is Ethereum, ETHUSDT, a great chart setup. Once the breakout happens, it will never trade at this price ever again. This is the last chance. It is yours to take.
Thanks a lot for your continued support.
I am wishing you profits, health, wealth and success.
You are appreciated, always, and you deserve the best.
Namaste.

Ethereum Vs "Lots Of People""Lots of people are saying Ethereum will go very low and..." They were right, Ethereum is already trading extremely low, same prices as in the March 2023 wick low and a bullish reversal is about to happen. The low is in and confirmed, it happened on the 7-April session. You shouldn't listen, believe or follow "lots of people." "Lots of people," doesn't have any substance, race, color, ideas, beliefs, shape or form. There is no such thing as "lots of people." There is only me, you and the chart.
This simple chart says it all, but the main signal comes from the smaller Altcoins and those pairs that are moving ahead. I am now seeing pairs breaking up producing 80% within a single candle in a few hours. Just two days ago the breakouts were maxed out at 40%, today it is going higher and its been only 48 hours.
Bullish momentum will continue to build up and grow. Bullish action will encompass the entire Cryptocurrency market in a matter of weeks. Full blown bullish action in late May 2025. But it is happening now but still early.
Let's forget my own personal bias and consider the chart signals.
Ethereum bottomed June 2022. Right now it is trading within a long-term higher low and support has been found at the same March 2023 level.
The March 2023 low was only a wick, the session close happened within a long-term sideways period between January and October 2023, the unbreakable, long-term support zone. Ethereum is now safely trading within this range. Since it took Ethereum 280 days to develop this support level, it won't break with a single candle and, the low in March 2023 was $1,369 while on the 7-April weekly session it ended at $1,384. Technically, this is a double-bottom but the small difference in price means that buyers were expecting this drop and were ready to buy.
A break of this support zone would need a challenge of this lower wick. The next week, this week which is still active, we have a very strong higher low and another Doji and reversal candle. The previous candle itself is a reversal signal as it came as a Doji and green. The trading volume reveals a bias towards the bullish side. The highest bearish volume already happened in February, revealing the fact that the bears ran out of strength already and all the ammunition they had—already spent.
November 2025 is the most likely date but a top can also happen in August or October 2025. If the general market pattern changes, the bull market can extended into 2026 but this is unlikely, normally, it always happen in exactly the same way.
We want to see the bull market extended, but it can extend for some pairs and not for others, the market is too big right now. Some pairs are trading really high up, like Bitcoin, Solana, Binance Coin and Tron, while other pairs are trading at All-Time Lows. Those at All-Time Lows can extend until 2026, those really high can end early, anything goes.
Generalizations won't be of help, but it can fun for reading. We can fill ourselves with hope but then, the market does whatever it wants. We take action based on resistance and support. Buy now, sell when prices are up.
Namaste.

ETH USDT#ETH CRYPTOCAP:ETH
Ethereum is breaking the upper boundary of its descending channel on the 12H chart💁♂️
A successful breakout could trigger a massive rally with targets at $1,950, $2,120, $2,550 and $2,880🚀

ETH Rejection Incoming? Don’t Fall for This Bull TrapYello Paradisers, are you watching how ETH is reacting right now at this key zone? This could either turn into a textbook bearish setup… or catch everyone off guard. Let’s break it down 👇
💎ETHUSDT is currently hovering at a critical resistance area, perfectly aligned with both a key Fibonacci retracement zone and the 200 EMA—classic confluence. What makes it even more concerning is the bearish divergence, which is strengthening the probability of a downside rejection from this level.
💎To add fuel to the fire, the price action has just taken liquidity (inducement) above the previous highs, another bearish signal that supports the idea of a potential reversal from here.
💎However, this bearish bias will be fully invalidated if ETH manages to break and close a candle above the resistance zone. That kind of price action would suggest strength from buyers and a likely continuation to the upside.
💎In that case, it’s wiser to stay patient and wait for a cleaner setup at a better price. Rushing into a trade at this stage, especially in a moment of indecision, is not how pros operate.
If you want to be consistently profitable, you need to be extremely patient and always wait only for the best, highest probability trading opportunities.
MyCryptoParadise
iFeel the success🌴

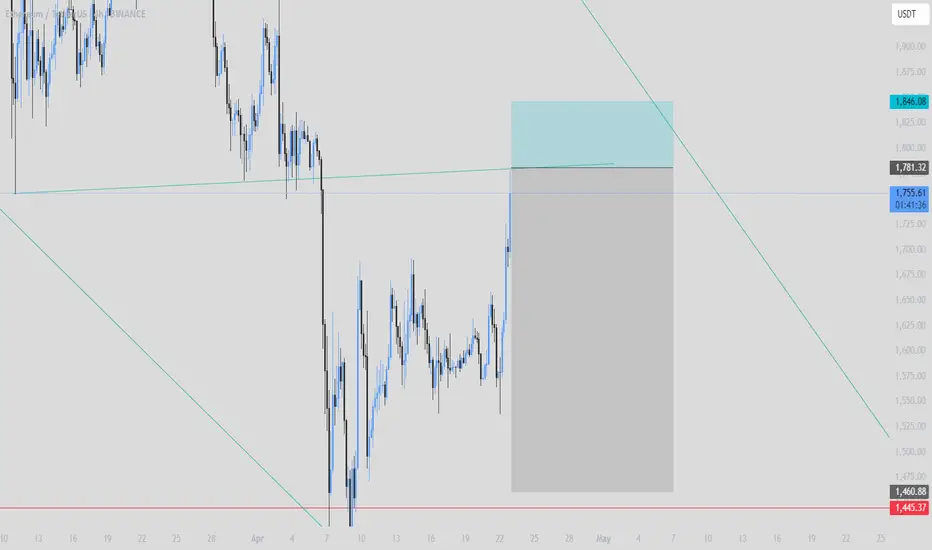
ETHUSDT – Eyeing a Potential Rejection Near 1650 ResistanceEthereum is currently in a downtrend, and the recent upward move appears to be part of a correctional phase. Price is now approaching the descending trendline and a key resistance area around $1650, which previously acted as support.
This zone could serve as a potential rejection area, especially if the broader bearish structure holds.

Ethereum (ETH): Buyers Establish Support, Waiting ConfirmationBuyers seem to have established a supportive zone where buyers are showing some kind of dominance on Ethereum.
Although it is early to say that this would be the bounce zone for us, we need to see some sideways movement or a retest of that support zone, after which we are going to look once again for dominance to fall into buyers hands.
Once we see that we are going to look for MSB to form, and then we will be looking for a long position here.
Swallow Academy

Long trade
🔥 Trade Breakdown – Buyside (ETH/USD)
📅 Date: Friday, April 18, 2024
⏰ Time: 9:14 AM (NY Session AM)
Pair: ETH/USD
📈 Trade Direction: Buy (Long)
Trade Parameters:
Entry: 1599.77
Take Profit (TP): 1612.93 (+0.82%)
Stop Loss (SL): 1595.77 (–0.25%)
Risk-Reward Ratio (RR): 3.29
🧠 Trade Narrative:
Buyside intraday execution during the NY AM session sets the tone for directional bias based on liquidity sweep and continuation to the upside.

Ether short from 1755$Eth deserves no respect for how it has behaved during this bull run. Short this buttcoin.
Basics of trading , resistance hit , it does not break on the first try . I think she will dump again.
Ethereum (ETH): Waiting For 1 of 3 Entries At Least / Buy & SellEthereum is still in-between our dotted line area, which is acting as a supportive zone there. Despite seeing some sort of buying volume building up, we are not rushing into any trade but rather showing once again multiple entry zones we are looking for before entering the trade on ETH.
As always, we need to see a proper break of line and a retest in order to consider it a valid entry.
Swallow Academy
Ethereum (ETH): Our Attentions Are At Bollinger Bands Now, as many of you remember, we are aiming to see the bullish CME (on upper zones) to be filled on ETH, but there is no proper volume from any side currently.
So with this kind of sideways movement, our attention is at Bollinger Bands upper and lower zones, which are going to be our micro target zones while we see a proper BOS from either buyers or sellers.
Also keeping eyes on the middle line of Bollinger Bands, as this can be our trend ladder to either lower zones or upper zones. So let's keep on monitoring until we get more clarity.
Swallow Academy

ETH SHORTCRYPTOCAP:ETH 2H SHORT
The asset retains the potential to decline within the current structure.
The most favorable conditions for opening short positions can be formed after the test of POI 2. Also, the scenario of entry within the local zone of interest POI 1 (15m) remains relevant.
Target benchmarks: $1537, $1521, $1503, $1470.

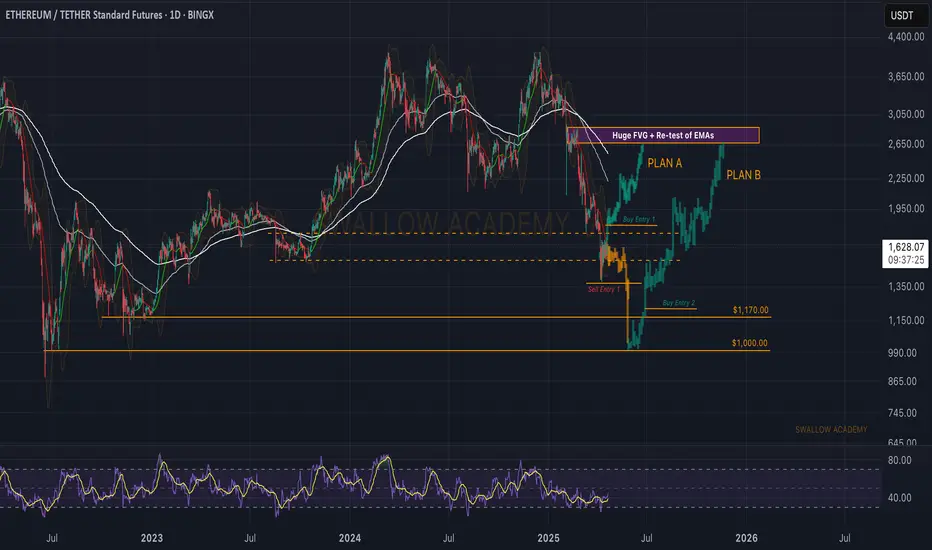
ETH/USDT Weekly – Approaching Key Accumulation ZoneEthereum is currently approaching a major support zone between $1,440 and $880, a level that acted as strong demand during previous market cycles. Price is currently below the Ichimoku cloud (Span A: $2,433 | Span B: $2,746), and the overall structure remains bearish unless price starts to break above recent swing highs.
Both Trend Strength Index (TSI) indicators are firmly in oversold territory:
TSI(10): -0.89
TSI(20): -0.97
This reflects deeply negative momentum, but historically, these levels have preceded strong reversals, especially when price enters high-timeframe support zones, like the one ETH is approaching now.
The $1,440–$880 range can be seen as a potential accumulation zone, and unless ETH breaks below $880, the bullish continuation setup remains valid. If price stabilizes here and begins reclaiming structure, especially above the $1,750–$1,950 levels, we could anticipate a move toward the $3,875 high or beyond.
Trade Setup Summary:
Accumulation Zone: $1,440 – $880
Invalidation: Break and close below $880
Bullish Trigger: Reclaim of recent swing highs
Target: $3,875 (major resistance)
Bias: Bullish while holding above $880
TSI: Deep oversold – conditions favorable for mid-term reversal
Ethereum fundamentals remain solid despite recent weakness. The upcoming upgrades to the Ethereum network (such as scalability and rollups) continue to support long-term utility, while institutional interest grows through ETH-based products and DeFi developments. Macroeconomic uncertainty, along with renewed ETF talks, could fuel a stronger recovery in the second half of the year. However, technicals must align with improving sentiment for this reversal setup to activate.
Disclaimer: This content is for educational and informational purposes only. It does not represent financial advice or a recommendation to buy or sell any financial instrument. Trading involves risk, and you should only trade with money you can afford to lose.
ETH at the middle of the road.Let's keep this short. $1600 has to be broken then $2K. The first resistance will likely be broken but not the second one.
$900 is the buying target for the dip buyers.

ETH SHORT TERM If the uptrend continues and we see a bullish Total chart (i.e. we get volume support) then this pose will work.
ETH swing Long IdeaI have in mind 2023 Lows, there is a weekly OB before it, so could provide some reaction, but ETH respects more high time frame S/R (support and resistance) so can provide a good trade for spot and perps

ETH gives a strong exit from the descending channel!Hello everyone, I invite you to review the current situation on ETH, because you can see a significant rebound at the level of 30% from the last low. When we enter the four-hour interval, we can see how the ETH price moved in the local downtrend channel, from which we got an exit at the top, such a scenario often gives increases at the level of the channel height, which would bring the price closer to the levels of $ 2100.
Here you can see how the current rebound brought the movement closer to the resistance at the level of $ 1830, and then resistance is visible at the price of $ 1950, where the ETH price must then face a strong resistance zone from $ 2060 to $ 2100, where there could potentially be an upward movement after leaving the channel as in this case.
Looking the other way, you can see that when the trend reverses, we first have support at the level of $ 1730, but if it is broken, the ETH price may continue to fall and return to a strong support zone from $ 1480 to $ 1380.
It is worth paying attention to the MACD and RSI indicators because you can see how in the 4H interval we have gone beyond the upper limits of the ranges, which may translate into visible price consolidation on the chart in order to cool the situation.


Ethereum Turns Bullish After SEC Leadership ChangeEthereum Turns Bullish After SEC Leadership Change
On Monday, the SEC announced that Paul Atkins is its new chairman.
Known for his support of crypto, Atkins is expected to push for more favorable regulations in the industry.
This news has sparked optimism in the market, leading to a strong bullish shift in Ethereum.
Traders are now watching closely to see if this momentum continues.
You may watch the analysis for further details!
Thank you!

ETH Analysis: Bearish Outlook ETH Analysis: Bearish Outlook
From previous price movements, ETH has shown strong reactions after retesting key structural areas. It tested 1943 before pulling back, and after breaking 1770, the decline accelerated.
Currently, ETH tested 1685 and is expected to move lower again. If it manages to rise slightly, it should not surpass 1770, which serves as a major resistance level. If it reaches this zone, the bearish wave could begin under a second scenario.
Overall, this reversal is taking place within a tight reversal zone, with price shifts limited to about 5% between key levels.
The bearish movement is anticipated to unfold as shown in the chart.
You may find more details in the chart!
Thank you and Good Luck!
❤️PS: Please support with a like or comment if you find this analysis useful for your trading day❤️
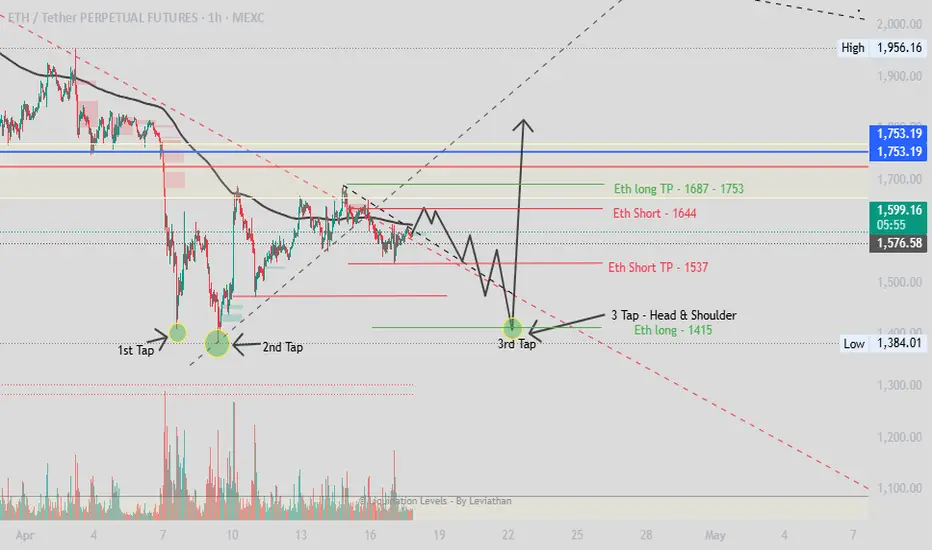
ETH - Short & Long Trades - All Upcoming Moves DefinedETH Short Trade:
After the break of ETH uptrend structure, topping at 1693 and making a local low at 1539, I would expect Eth to accumulate up to its supply zone at 1644 (Eth Short Entry Zone) before falling back down to 1537 (ETH Short TP Zone).
ETH Long Trade:
Looking at the previous lows, ETH has made two lows, 1st low at 1411, 2nd low at 1485, I would be expecting ETH to make another low at 1415 (ETH Long Entry) accomplishing the 3 Tap Pattern - Head & Shoulder. After this 3-Tap move is successfully completed, ETH should accumulate up to 1687 - 1753 (ETH Long TP Zone).