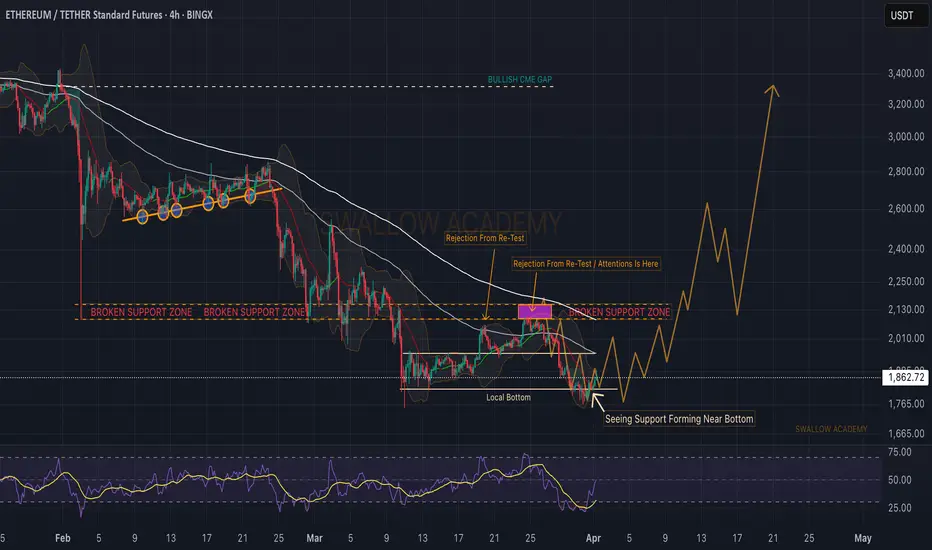
Ethereum (ETH): Support Forming Near Local Bottom / Might PumpEthereum is forming a proper support near our local bottom, which has been our point of interest for quite some time now.
We are going to wait now for upper resistance to be tested, where afterwards we will be looking for a break to happen where we will be looking for a long position.
Swallow Team
ETHBULLUSDT trade ideas
Is This the Start of ETH’s Next Mega Rally?#Ethereum just bounced off its strongest support since 2020! 🔥
This trend has held firm for 5 years, and ETH is respecting it once again.
This could be the start of the next big rally if history repeats.
Bullish momentum loading?
What’s your ETH target for this cycle? 👇

ETH - When will this downtrend finally stop?Ethereum (ETH) has been stuck in a prolonged downtrend, and the bearish scenario is now playing out. On the 4-hour chart, ETH recently broke below its rising trend line after forming a rising wedge that typically signals further downside. This breakdown confirms the potential for further downside.
At the same time, on the weekly timeframe, ETH has perfectly retested its resistance and failed to push higher, reinforcing overall market weakness. With failing to break resistance it is likely that ETH could face continued weakness and move towards the weekly support area at 1500.
Thanks for your support.
- Make sure to follow me so you don't miss out on the next analysis!
- Drop a like and leave a comment!

ETH is leaving exchanges , is a "supply shock" approaching ?Hello Traders 🐺
Today I’ve got some good news for ETH, and I also spotted a bullish pattern forming. Plus, I’ll talk about the short-term price targets, so stick with me until the very end—and don’t forget to like for more support! 👍🔥
Alright, let’s get into it:
According to Glassnode and Santiment, only 14% of the total ETH supply is left on centralized exchanges. That’s the lowest level in nearly 10 years — but what does it mean?
Usually, this type of data hints at major volatility incoming. And guess what? The big players are the ones playing this game. Let me explain:
They keep the price artificially low, slowly exhausting retail traders and shaking them out. Meanwhile, they accumulate quietly. Once their bags are full, they remove the sell pressure, and suddenly…
🚨 Supply shock.
People start panic buying, and with so little ETH available on exchanges, the price skyrockets.
Also, ETH transaction fees have dropped to their lowest levels since mid-2020, which I see as another bullish sign for Ethereum. Now let’s look at the chart:
We have a clear falling wedge pattern on the daily timeframe, along with a potential double bottom forming.
If the price breaks above the neckline of this “W” formation—which also aligns with a strong daily resistance—I expect a strong reversal for ETH. 📈🚀
Make sure to act accordingly, and as always:
🐺 Discipline is rarely enjoyable, but almost always profitable 🐺
🐺 KIU_COIN 🐺

Ethereum’s High Time Frame Outlook: Key Support LevelsHello Traders,
in our second update for today, we are taking a closer look at Ethereum (ETH) on the higher time frame following the recent monthly close. The price has seen a strong bearish expansion from the $3,700 resistance level, pushing ETH into the 0.618 Fibonacci retracement zone, with the Value Area Low (VAL) of the high time frame range sitting just below it. While this is a technical trade location, there is currently no clear sign of a bounce, meaning we need to wait for further price development before considering any reversal scenarios.
If Ethereum continues its downward trajectory, the next key support sits at $1,196. This level will be crucial, as a bullish reaction here could increase the probability of a rotation back toward the highs. However, for now, price action remains rotational on the higher time frame, and the monthly trend is still in a clear downtrend with no immediate signs of reversal.
Key Technical Points to Consider
• ETH has rejected strongly from the $3,700 monthly resistance, leading to a bearish expansion into the 0.618 Fibonacci retracement zone.
• There is no clear bullish reaction yet, meaning traders should wait for further price action confirmation before considering a bounce.
• The next key support at $1,196 is critical—if price reaches this level and finds buyers, it could trigger a rotation back toward the highs.
Potential Scenarios & Conclusion
If Ethereum stabilizes within the 0.618 Fibonacci region and forms a strong bullish reaction, it could signal a potential short-term bounce. However, without confirmation, the risk of further downside remains, with $1,196 acting as the next major support level.
Traders should approach the market with caution, as the monthly trend is still bearish, and a clear reversal signal has yet to emerge. Until price action provides stronger confirmation, Ethereum remains in a rotational phase, requiring patience before determining the next high-probability trade setup.

ETHERIUM (ETH) - Monitor for a Possible Long using Lesson 15Lesson 15 Methodology
A few of the criteria have been met:
1. Support Level
2. Highest Up Volume Wave after a while
3. Anchored AVWAP at the previous down wave and priced crossed above
4. Price has pulled back to AVWAP
...and now I am waiting for a Plutus Long signal that will push price above AVWAP to enter Long!

ETH looks like a giant bull flagWell the subject about says it all, I am hopeful, og hodler no gains no pain!

ETHUSDWith the weekly candlestick that closed last night,
There are no signs of weakness in the Ethereum chart and I expect to see a 1650 range based on the liquidity inflow chart.
Of course, this analysis is completely dependent on macroeconomic data and we will have to see what happens in the next few days with Mr. Trump's tariffs, unemployment rates, and the Fed meetings.
As always, we are moving in step with the market.
Best regards

ETH Mar. 28All currencies appearing in this post are fictitious. Any resemblance to real currencies, existing or dead, is purely coincidental.

Go shortOne last leg lower before we go up
this is my idea of a quick snap to the downside for hunting the stops
Not an financial advice

First blood baths, then money baths.It is always useful to look at charts over the longest possible period.
* What i share here is not an investment advice. Please do your own research before investing in any asset.
* Never take my personal opinions as investment advice, you may lose all your money.

ETH/USDT LongETH/USDT #LONG
Leverage: cross 125 x w
Entry 1808
Targets - 1850 - 1870 - 1890 - 1930- 2140
Stop loss 1740 BINANCE:ETHUSDT.P

ETH Weekly OBAround th 1,655 level, theres a weekly OB waiting to be tapped.
IMO, the continuation of dumping suggests that price could tap this level before the start of april.
Theres no signs of reversal yet, even with BTC, and with Trumps announcement with new tariffs I expect to welcome april tapping that OB

ETHUSDT - when the second leverage liquidate?- I'm waiting for the momentum to accelerate and liquidate.
- in the 1700-1500 zone, the buyer's zone.
- there may be a false break at first

ETH Possible 300% in 2025 but with a short-term turbulenceETH/USD chart looks very bullish at first glance but if you look closer then you might find some bearishness in the short-term
ETH formed double TOP in the spring time and since then it was in down trend.
Current up move for me seems like just retest of July high.
In the upcoming alt-season ETH will lead the market but before that it may drop much lower into 1500-2000$ region.
From that place, while panic on the market ETH can easily make x2-x4
Patience! Wait until good entry point come to you

ETH - Bearish Reversal Expected from FVG ZoneIn this 1-hour chart analysis of ETHUSDT on Bybit, we observe a potential price reaction from a Fair Value Gap (FVG) zone. The current downtrend has left an imbalance in the market, and price is retracing towards the 0.618 - 0.65 Fibonacci retracement levels , which align with the FVG area.
Key Observations:
🔹 Market Structure: The price is in a bearish trend, forming lower highs and lower lows.
🔹 FVG & Fibonacci Confluence: A strong resistance zone is marked within the $1,980 - $2,000 range, coinciding with the Golden Pocket (0.618 - 0.65 Fib levels) .
🔹 Expected Price Action:
- A bullish retracement ( green path ) into the FVG zone.
- A rejection from this resistance area, leading to a continuation of the downtrend ( red paths ).
- Potential targets for the drop are around $1,860 - $1,800 , aligning with previous liquidity zones.
Trading Plan:
📌 Short Entry: Around $1,980 - $2,000 if rejection signs appear.
📌 Stop Loss: Above $2,020 to invalidate the bearish setup.
📌 Target: $1,860 - $1,800 based on historical support levels.
This idea is based on market imbalance and liquidity dynamics , so watching for confirmation before entering a trade is crucial. 🚀🔍

#ETHUSDT is showing a reversal pattern📊 BYBIT:ETHUSDT.P is showing a reversal pattern — we expect the uptrend to continue if the breakout level holds!
🕒 Timeframe: 4H
➡️ BYBIT:ETHUSDT.P has formed a potential Double Bottom (Bottom 1 and Bottom 2) around $1,785–$1,809, indicating a possible trend reversal.
➡️ The key trading range (POC — Point of Control) is at $1,881.71, making it a major resistance level.
➡️ The price is also bouncing off the support zone, which aligns with the previous consolidation area.
➡️ Volume is increasing during the bounce, confirming buyers’ interest.
⚡️ Considering a potential long entry
⚡️ Maximum target based on the pattern — $2,522
📍 A breakout and hold above $1,849.71 will confirm the bullish scenario and attract more long liquidity.
📢 If the price drops below $1,785, the setup will be invalidated — high chance of a continued downtrend.
📢 The rise of BYBIT:ETHUSDT.P is possible due to reactions to the strong support zone and the forming Double Bottom pattern.
🕒 Timeframe: 1H
➡️ BYBIT:ETHUSDT.P has formed a Falling Wedge , which is a bullish pattern.
➡️ A second bottom ( Bottom 2 ) has formed, confirming a potential reversal.
➡️ The upper boundary of the wedge has already been broken, accompanied by a spike in volume.
➡️ A strong consolidation zone exists around $1,808–$1,820 — a retest could confirm a long entry.
⚡️ Holding above the wedge breakout is a signal for further upside.
📢 If the price falls back below $1,800 and buying momentum weakens — the scenario should be reconsidered.
📉 LONG BYBIT:ETHUSDT.P from $1851.0
🛡 Stop loss: $1835.00
🕒 Timeframe: 1H
🎯 Targets (TP):
💎 TP 1: $1860.00
💎 TP 2: $1871.00
💎 TP 3: $1882.00
💎 TP 4 (long-term target): $1890.00
🚀 BYBIT:ETHUSDT.P is maintaining a potential reversal pattern — we expect upward movement if volume confirms!

Order block at discount zone for ETHBetween 1850 and 1750 is the discount zone for eth right now. If it fails to hold this zone massive drops will happen.
However a rebound is more likely due to RSI being so low at this time.
4 hour chart broke thru 2 buy zones to his this discount spot and we could see prices ranging from 1850 to 2060
Be are on lower time frames and traps
Good luck

Ether long LTF long . Lets try to catch a local bottom . Very hard conditions to be honest.
Who would have thought that we would be fighting for this but here we are.
Nice rejection at the lows so far. Lets see and wait.

ETH: Possible Scenario!Hello Traders,
Here's a quick update on ETH in the weekly timeframe.
ETH is currently in a downtrend, trading at $1,890. It has already faced a 57% drop, and the trend is likely to continue.
Based on this weekly analysis, I expect ETH to drop to $1,400, where we have a support level. In a worst-case scenario, it could fall to $1,000. A rebound toward $2,200 is possible from the current market price, but it may not sustain for long.
Conclusion:
✅ Potential Accumulation Range: $1,000 - $1,400
✅ Lower Support: $1,000
Note: Always do your own research and analysis before investing.

ETH-----More around 1865 target 1800 areaTechnical analysis of ETH contract on March 30: Today, the large-cycle daily level closed with a small negative line yesterday, the K-line pattern continued to fall, the price was below the moving average, and the attached indicator was running with a golden cross and shrinking volume. The big trend was still very obvious, but I would like to remind you that the current price deviates from the moving average, and if there is a rebound trend in the future, it is also a correction trend. Don't be misled; the short-cycle hourly chart showed that the European market fell and the US market continued to break the low yesterday, and the morning support rebounded and corrected. The current K-line pattern continued to rise, and the attached indicator was running with a golden cross, so it still needs to be corrected within the day, and the high point of the US market correction yesterday was in the 1865 area.
Today's ETH short-term contract trading strategy: sell at the rebound 1865 area, stop loss in the 1895 area, and target the 1800 area;

2x Long for ETH will give %15Eth just bounced off the purchase support. 2x long position can now be an option.

