Multiple resistance tests in a fully formed falling wedge As we can see right here, there has been multiple touchdowns in the upper trend line of the huge falling wedge. This might indicate a break above and retest and going forward. Even there are some pretty decent bullish divergences on lower time frames as well.
ETHBULLUSDT trade ideas

Very nice long position on ETHAll is on the chart, we can try a long from here because there is an old restance trend line that is becomed a very good support, after tht we have in green rectangle forming a good support for eth, max leverage 10x even if i suggest 5x, please let me know what you think, last idea on ETH was a falling wedge and i did a big profit with 10k leveraged x10, let me know what do you think guys?? thanks a good monet for everybody

ETHUSDT NEXT MOVESell after bearish candle stick pattern, buy after bullish candle stick pattern....
Best bullish pattern , engulfing candle or green hammer
Best bearish pattern , engulfing candle or red shooting star
NOTE: IF YOU CAN'T SEE ANY OF TOP PATTERN IN THE ZONE DO NOT ENTER
Stop lost before pattern
R/R %1/%3
Trade in 5 Min Timeframe, use signals for scalping

ETH-----Sell around 1825, target 1750 areaTechnical analysis of ETH contract on April 4: Today, the daily level of the large cycle closed with a small positive line yesterday, and the K-line pattern was a single positive line with continuous negative lines. The price is still below the moving average and is obviously suppressed. The fast and slow lines of the attached indicator continue to close negative today, so the pattern will cross downward. Therefore, the general trend remains unchanged and continues to be bearish. Trading remains short-term and risk control is done well; the short-term price decline yesterday broke the previous low of 1750, but did not continue. The current price fluctuates within the range and there is not much movement. From the perspective of various technical indicators, the four-hour chart is a continuous negative line, and the intraday price is suppressed, so the trend is still bearish, and the previous correction high is near 1850.
Today's ETH short-term contract trading strategy: sell at the 1825 area, stop loss at the 1855 area, and target the 1750 area;

#ETH #ETHUSDT #ETHEREUM #LONG #SWING #Analysis #Setup #Eddy#ETH #ETHUSDT #ETHEREUM #LONG #SWING #Analysis #Setup #Eddy
ETHUSDT.P Swing Long Analysis & Setup
Important area of the upper time frame for swing are identified and named.
This setup is based on a combination of different styles, including the volume style with the ict style.
Based on your strategy and style, get the necessary confirmations for this Swing Setup to enter the trade.
Don't forget risk and capital management.
The entry point, take profit point, and stop loss point are indicated on the chart along with their amounts.
The responsibility for the transaction is yours and I have no responsibility for not observing your risk and capital management.
🗒 Note: The price can go much higher than the second target, and there is a possibility of a 500% pump on this currency. By observing risk and capital management, obtaining the necessary approvals, and saving profits in the targets, you can keep it for the pump.
⚠️ Warning : The stop loss is dramatic and large. Place the stop loss based on your strategy and after getting entry and confirmation on the entry point behind the last shadow that will be created. (( This is just my opinion and is not meant to be 100% correct, so be careful with your capital. ))
Spot Investing : ((long 'buy' position)) :
🟢 Entry 1 : 1800
🟢 Entry 2 : 1500
First entry point calculations :
⚪️ SL : 1370 ((23.89%))
⚫️ TP1 : 4500 ((150%))
⚫️ TP2 : 5000 ((177.78%))
⚫️ TP3 : 8000 ((344.44%))
⚫️ TP4 : 10000 ((455.56%))
‼️ Futures Trading Suggested Leverages : 3-5-7
The World Let it be Remembered...
Dr. #Eddy Sunshine
4/4/2025
Be successful and profitable.
Do you remember my first Ethereum swing long signal?
My first swing long signal was provided on Ethereum, which was spot pumped by more than 100% and was profitable :

1:3 RR ETH SHORTI just found it as a good trade
ETH needs more Liquidity so I prefer to sell instead of buy
Good Luck

Ehtereum (ETH) - Entered Long based on Lesson 15Lesson 15 Methodology;
1.Support Level
2. Largest Down wave after a while (Buyers possible entering)
3. Placed AVWAP and wait to cross upwards and pullback
4. Enter on Plutus signal Long in this case PL

Divergences Everywhere — Bears Want You Out! Hello Traders 🐺
This is a short and quick emergency update for ETH, because I personally think that we are about to see a massive reversal in the market, especially in the Altcoin section:
1_ Falling wedge: ETH is inside a falling wedge pattern just like BTC. They have the same pattern and also we have clear signs of bottoming out for both of them.
2_ Bullish divergence on the Daily chart: If you pay close attention to the RSI, you can see that we have a massive bullish divergence and this means breakout is so imminent for ETH, and this is going to be to the upside rather than downside, because honestly we are about 60% down from the ATH price — which in my opinion is enough correction for bulls to come back and take control.
3_ BTC.D is about to top out: If you saw my last idea about it, you know that we have a very huge bullish divergence — not on the daily, not even on the weekly! We have it on the monthly chart!!! That's f..king enough to be extremely bearish on BTC.D and be over bullish on ETH and Alts as well.
4_ ETH/BTC is very close to the monthly support and demand area: I will publish a complete idea about it because this is beyond the current idea and I have to explain it in detail.
Oh right guys, I hope you make the right decision — and also always remember:
🐺 Discipline is rarely enjoyable, But almost always profitable 🐺
🐺 KIU_COIN 🐺

Ethereum (ETH): Losing Important Zones, We Might Fall To $1,500This last couple of months has been really hard for Ethereum, where we saw ay ATHs and currently we are not seeing any proper signs of recovery where usually after Bitcoin market dominance the volume flows into Ethereum.
Nevertheless, while we see a chance that price will dip more down, we are still looking for a recovery here.
Our points of interest are both the $1,900 zone and the $1,500 zone, where most of the liquidity is lying currently. As long as we are above $1500, we are bullish on Ethereum, but currently we see how weak the markets are so we wait for proper support to form!
Swallow Team

Ethereum (ETH): Most Important Zone For EthereumWe are in one of the most important zones for Ethereum, where we are looking for 2 possible scenarios currently.
1) Ideally we should see a buying volume to build from here, which would give us a good buying opportunity once we see an MSB to form on smaller timeframes.
2) If sellers keep this kind of dominance, we will fall to a lower size of our zone, which is $1,500.
Currently, Monday has been pretty weak so we might have to wait more for a proper support zone to form but keep your eyes on EMAs; they are way too far from the market price, which usually means a possible quick movement can happen!
Swallow Team

Ethereum (ETH): Price Struggles To Establish Support Zone.As we monitor the markets, ethereum has dipped nicely to our second bottom, but we got close to our sell entry zone here, which is showing the great dominance of sellers.
As we enter the weekend market, we most probably will see some volatility, but nevertheless, we wait for one of our entries to be broken and secured (properly re-tested).
Swallow Academy

ETH strong byhistory repeats itself - the main postulate of market analysis. Here I see a standard scheme for capturing liquidity. A level is created behind which market participants place stop orders. As soon as a large number of them accumulate there, the price breaks through this level, collecting liquidity. With a sharp return behind the level. This is how bitcoin turned around from 16k

ETH/USDT:UPDATEHello dear friends
Given the price drop we had, a head and shoulders pattern has formed within the specified support range, indicating the entry of buyers.
Now, given the good support of buyers for the price, we can buy in steps with capital and risk management and move towards the specified targets.
*Trade safely with us*

Is Ethereum dying?Ethereum is expected to fall to $1,000 support after breaking its dynamic support line and if there is no support at this price, it will drop to $100

FALLLLLLLIIIING ETHUSD.PDoes not need any descriptions... :)
the target level is the level of unfilled orders remains from old days ...

ETH heads for goblin townETH is heading for goblin town of $1540 as there's no support on the daily; the nearest major support is $1540 on the weekly chart. Look to enter $1860ish, but could wick up, so don't overleverage

ETH-----Sell around 1840, target 1770-1750 areaTechnical analysis of ETH contract on April 3: Today, the large-cycle daily line level closed with a medium-yin line yesterday, the K-line pattern was a continuous Yin and a single Yang, the price was below the moving average, and the attached indicator was dead cross, so there was no problem with the trend and it was still falling significantly, but the trend this week was more volatile, and it was greatly stimulated by the news and data. The rhythm of trading is very important; the four-hour chart is the focus, the current K-line pattern is a continuous Yin, the attached indicator is dead cross, the morning fell, and the correction was made during the day. It was just corrected to the 1845 area near the moving average pressure position, so we still have to focus on the price continuing to break in the European session. In addition, the same anti-pull strength cannot be large, otherwise it will still fluctuate.
Therefore, today's ETH short-term contract trading strategy: sell directly at the current price of 1840, stop loss in the 1870 area, and target the 1770-1750 area

Ethereum (ETH): Sellers Are Pressuring, Approaching Sell EntrySellers are not showing any remorse, and we see a strong dominance on their side currently.
Slowly we are approaching the sell entry of ours, whereupon seeing a breakdown, we expect the price to fall as low as $1500.
Swallow Academy

ETH/USDT – LONG - Breakout Trade Setup
ETH is showing bullish momentum on the 1H chart. A breakout above resistance targets 1,952, with key support at 1,870 and 1,822 (Fibonacci levels). Stop-loss at 1,812 for risk management.
Watching for confirmation before entry!
💡 Risk Management: Always follow a risk management strategy and never risk more than you can afford to lose.
🔔 Disclaimer: This is not financial advice. The content is for personal record-keeping and educational purposes only. Traders should conduct their own research before making any trading decisions.

Ethereum Price Analysis: Is a Drop to $1,550 Imminent This Week?As of April 3, 2025, Ethereum (ETH) is trading at approximately $1,838 (based on recent market data), reflecting a precarious position in the crypto market. After a volatile start to the year, ETH has shed over 44% year-to-date and is now testing critical support levels. This analysis explores the potential for an 11% drop to the $1,550 range within the next few days (by the end of this week, April 6), driven by technical breakdowns, bearish on-chain signals, and broader market pressures.
Technical Analysis: Bearish Signals Mounting
On the daily chart, ETH has been struggling to maintain momentum above the $1,800 psychological level. After a brief bounce from its yearly low of $1,760 on March 11, the price has failed to reclaim the $2,000 mark—a key resistance zone that previously acted as support in late 2024. Here’s a breakdown of the technical setup:
Key Support Breach: The $1,800–$1,877 range has been a critical support zone, aligning with the 61.8% Fibonacci retracement level from the December 2024 high of $4,106 to the March 2025 low of $1,759. A close below $1,770 this week would confirm a breakdown, opening the door to the next major support at $1,550–$1,600, a level last tested in October 2023.
Bearish Pattern Confirmation: The 2-hour chart shows ETH completing a corrective structure (likely an A-B-C wave) after its March 19 peak at $2,070. If wave C mirrors wave A in length—a common Elliott Wave scenario—the target aligns near $1,550, coinciding with the 1.61 external Fibonacci retracement of the recent bounce.
Moving Averages: ETH is trading below both its 50-day SMA ($2,321) and 200-day SMA ($3,010), signaling a sustained bearish trend. The 50-day SMA, now sloping downward, acts as dynamic resistance, capping any relief rallies. A failure to reclaim this level soon reinforces the downside risk.
RSI Oversold but Weak : The 14-day Relative Strength Index (RSI) sits near 30, indicating oversold conditions. However, in strong downtrends, RSI can remain oversold for extended periods, as seen during ETH’s 2022 bear market. Momentum remains weak, with no bullish divergence to suggest an imminent reversal.
Target Projection : A drop from $1,838 to $1,550 represents an 11% decline, achievable within 2–3 days if selling pressure accelerates. The $1,550 level aligns with historical support and the long-term 78.6% Fibonacci retracement, making it a plausible target.
On-Chain Data: Selling Pressure Intensifies
On-chain metrics paint a grim picture, supporting the bearish technical outlook:
Exchange Reserves Rising: Ethereum’s exchange reserve has ticked up from 18.3 million ETH, reversing a multi-month decline. This suggests long-term holders or institutions are moving assets from cold storage to exchanges, potentially preparing to sell.
Whale Activity: Recent data shows significant whale sell-offs, with large transactions (over 100 ETH) spiking in the past 48 hours. This aligns with posts on X noting whale distribution near current levels, adding downward pressure.
DeFi Weakness: Ethereum’s dominance in decentralized finance (DeFi) is waning, with total value locked (TVL) dropping as competing Layer-1 chains gain traction. Reduced network activity undermines ETH’s utility-driven demand, a key pillar of its value proposition.
Staking Dynamics: While staking activity increased post-Shapella upgrade, the anticipated selling pressure from unstaked ETH continues to linger, especially as macroeconomic uncertainty prompts profit-taking.
Market Sentiment: Fear Dominates
The broader crypto market is reeling from macroeconomic headwinds. The U.S. Core PCE Index rose to 2.8% in February, exceeding the Federal Reserve’s 2% target, signaling persistent inflation. Higher interest rates for longer dampen risk-on assets like cryptocurrencies. Posts on X reflect growing pessimism, with some traders eyeing sub-$1,000 levels if $1,760 fails—a sentiment echoed by Ethereum’s 7% drop this week alone.
Bitcoin (BTC), trading near $82,000, has also faltered, dragging altcoins lower. ETH’s correlation with BTC remains high (around 0.9), and a failure to hold $80,000 for BTC could amplify ETH’s decline. Additionally, the lack of immediate catalysts—such as ETF approvals or major network upgrades—leaves ETH vulnerable to further capitulation.
Price Scenarios and Key Levels
Bearish Case (Base Scenario): A daily close below $1,770 triggers a swift move to $1,550–$1,600 by April 6. Volume spikes and panic selling could push it lower, though $1,550 offers strong historical support.
Bullish Rejection: A reclaim of $2,070 (the March 19 high) invalidates the bearish setup, potentially sparking a relief rally to $2,250. This seems unlikely without a significant BTC breakout or positive news.
Invalidation: A close above $2,120 this week would negate the short-term bearish thesis, though resistance at the 50-day SMA ($2,321) caps upside potential.
Trading Strategy
Entry: Short ETH below $1,770 with confirmation of increased volume.
Target: $1,550 (11% drop), with a stretch goal of $1,500 if momentum persists.
Stop Loss: $1,911 (intraday high from April 2), limiting risk to 4–5%.
Risk/Reward: Approximately 2.5:1, assuming a $1,550 target.
Conclusion
Ethereum’s technical setup, coupled with bearish on-chain signals and a fearful market, suggests an 11% drop to $1,550 is plausible by the end of this week (April 6, 2025). The $1,770 level is the line in the sand—watch it closely. While oversold conditions hint at a potential bounce, the lack of buying conviction and macro pressures tilt the odds toward further downside. Traders should monitor BTC’s price action and exchange inflows for confirmation. Stay nimble, and let the charts guide your next move.

Ethereum Elliot Wave Theory: $19,000 & Altcoins Market UpdateThe market is shaking but nothing truly changes. Ethereum is on a path that will end with a price above $10,000 USD. Ether (ETHUSDT) can easily trade at $11,111, $15,000 or even $19,000 in the latter part of 2025. Think about the market conditions and sentiment when Ether trades above 10K. Take a moment to think. Visualize. What do you see, hear, sense or feel?
The low was set March 10. Ethereum has been bearish since March 2024.
11-March 2024 was the main and first peak.
10-March 2025 was the main bottom and low.
An entire year of bearish action. The market never moves straight down nor straight up. The bullish action in late 2024 is part of a complex correction. It can be called an inverted correction within a long-term correction.
The last bear-market ended with a bottom being hit June 2022. This was followed by slow but steady growth; bullish consolidation. Prices were sideways but producing higher lows. Then a bullish wave developed to end 2023 and went through March 2024. March 2024 marked the end of this cycle and the start of a major, long-term complex correction. This correction ended last month. The end of the correction marks the start of the next bull-market cycle. The 2025 bull-market. This bull-market is not yet fully obvious but it will be clear within less than 2 months. There will be growth but for the majority of the participants to realize that yes, it is happening, it will take even longer.
Altcoins Market In General
Some projects bottomed in February, others in March. Most of them ended their correction in February 2025, there are always variations. This low is a long-term higher low. Many projects bottomed in late 2024. After a strong rise to end the year, we had a correction and this puts us in the current situation. Once the correction ends (already over) a new bullish impulse starts. The bullish impulse is composed of five waves. Three moves forward with two steps back.
➢ The first wave is up and green. Wave 1.
➢ The second wave is down and red. Wave 2.
➢ The third wave is the biggest wave. This wave tends to produce the highest volume and lots of momentum. Up and green. Wave 3.
➢ The fourth wave will be down and red and it will alternate the second wave. For example, if the second wave is long in duration, the fourth wave will be short. If the second wave is fast, the fourth wave will be slow. Etc. Wave 4.
➢ The fifth wave signals the end of the bullish impulse and this is the speculative wave. This is where anything is possible. Anything can happen within this wave. Trading volume will be lower compared to the third wave but new All-Time Highs are hit here and after this wave is over, the start of a new long-term correction or bear-market. Wave 5.
This is the map based on Elliot Wave Theory terminology. Everything is looking ready right now.
Signals are starting to show pointing to the start of major growth. What one does, the rest follows. Look at EOS. I just shared an article. Visit my profile and read it for a simple and quick example.
Don't be surprised when Ethereum trades above $10,000. Be prepared.
Take profits when prices are high and up.
The time to buy is now. Focus on the long-term.
Thanks a lot for your continued support.
Namaste.

ETH at a critical Zone - Bounce or Drop?Ethereum is trading at a key level. Will we see a strong reversal to the upside, or is a deeper drop coming? What's your expectation?
Share your thoughts below!
Kindly support this idea with a LIKE👍 if you find it useful🥳
Happy Trading💰🥳🤗

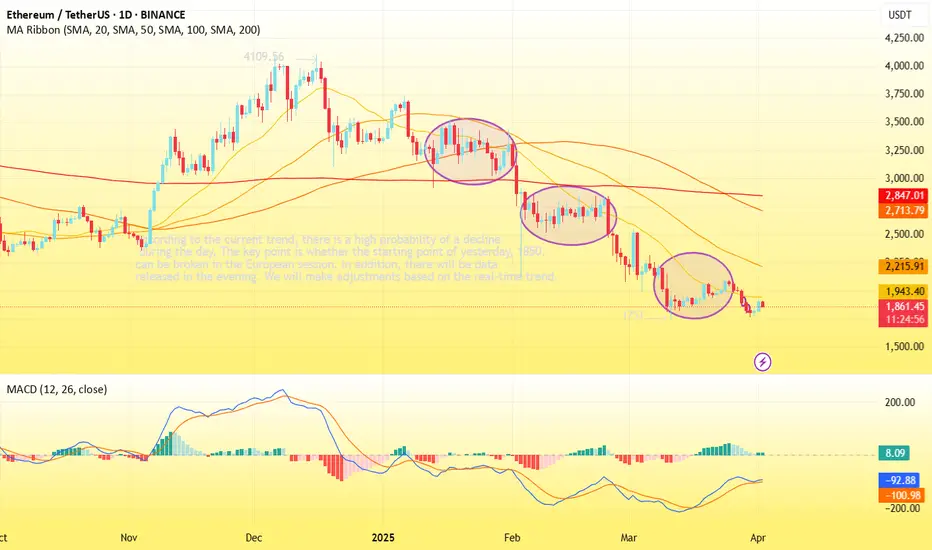
ETH-----Sell around 1900, target 1820 areaTechnical analysis of ETH contract on April 2: Today, the large-cycle daily level closed with a small positive line yesterday, and the K-line pattern was a single positive line with continuous negatives. The price was at a low level, and the attached indicator was a golden cross with a shrinking volume, but it can be seen that the fast and slow lines are still below the zero axis, which is an obvious price suppression, and the current pullback trend is only a correction performance, which is difficult to continue and difficult to break. This is the signal, so the downward trend remains unchanged; the correction trend of the four-hour chart for two consecutive trading days is also completed. At present, the K-line pattern is continuous negative, and the price is under pressure and retreats. Whether the European session can break down is very critical. The short-cycle hourly chart of the previous day's US session hit a high in the early morning and retreated under pressure in the morning. The current K-line pattern is a continuous negative and the attached indicator is dead cross running. It is still bearish during the day. The starting point is near the 1850 area. The European session depends on the breakout of this position.
Therefore, today's ETH short-term contract trading strategy: sell at the pullback 1900 area, stop loss at the 1930 area, and target the 1820 area;