Ethereum (ETH): Ideally We Need To See a Re-TestEthereum is still in unstable zones where we did not have a proper re-test of the broken zone but we see chunks of weakness on the markets near current zones.
So we keep an eye on 2 zones: the upper re-test zone and that lower yellowish line.
Upon breaking the yellowish line, we will see an early selloff, and if we see a touch to the upper resistance zone, then we will be looking for a weakness and an entry for short from there!
Swallow Team
ETHBULLUSDT trade ideas
Lingrid | ETHUSDT October 2023 LEVELS ReachedBINANCE:ETHUSDT price continues to push lower, reaching the support level that was last tested in October 2023. Historically, we can observe similar price action from 2021, when the price fell from the 4300 level and subsequently bounced off the 1700 support zone, leading to all-time highs. On the current chart, we see that the price has broken above the downward trendline that has acted as a resistance zone for the month. I think the price will continue to move sideways for the next couple of weeks, potentially pushing higher if we see buying pressure from the support level. My goal is resistance zone around 2190
Traders, If you liked this educational post🎓, give it a boost 🚀 and drop a comment 📣

Ethereum Set to Drop 15%: $1,750 Target Ahead, Stay Alert!Hello and greetings to all the crypto enthusiasts, ✌
All previous targets were nailed ✅! Now, let’s dive into a full analysis of the upcoming price potential for Ethereum 🔍📈.
Ethereum is currently navigating within a downward channel, with the possibility of establishing a parallel channel. Based on technical indicators, there is a projected 15% decline toward the identified support level on the chart. This forecast aligns with prevailing market trends and resistance points. The primary target for Ethereum in this scenario is $1,750, and it’s crucial for investors to remain vigilant and adjust their strategies as market conditions evolve.📚🙌
🧨 Our team's main opinion is: 🧨
Ethereum is in a downward channel, and I’m expecting at least a 15% drop to the support level, with a target of $1,750, so investors should stay alert and adjust accordingly. 📚🎇
Give me some energy !!
✨We invest hours crafting valuable ideas, and your support means everything—feel free to ask questions in the comments! 😊💬
Cheers, Mad Whale. 🐋

ETH UPDATE MARCH 18 2025(Candle Close BELOW???)Eth update for today March 18 2025 , kulang pa sa kape intindihin nyu na lang , share your thoughts

ETH/USDT Weekly Chart Analysis. The Ethereum (ETH/USDT) weekly chart suggests a potential bullish reversal from a key support area. Here are the details of the analysis:
Support area: Around $1,750 – $1,830, where the price recently rebounded.
Resistance levels:
First target: $4,015
Key resistance: $4,663, which marks a key breakout level.
ETH has bounced off historical support levels, indicating potential accumulation.
If the price sustains above $1,800, the next target is $4,015, followed by $4,663 if the momentum continues.
A break below $1,747 – $1,700 could lead to further declines, with the next strong support near $1,053.
Look for a confirmation of a breakout above $2,000 to confirm a strong uptrend.
Keep an eye on volume and indicators (RSI, MACD) for further confirmation of momentum.
Risk management is important in volatile market conditions.
If you found this analysis helpful, hit the Like button and share your thoughts or questions in the comments below. Your feedback matters!
Thanks for your support!
DYOR. NFA

ETH USDTETH is trading at a key support level, signaling a potential strong rebound. If buyers step in, a sharp upward move could follow.

Ethereum price dropETH price drop after stop hunter .
Ethereum grows in price to stop those who buy shorts and then suddenly drops.

ETH Bounce Here? | BTC | XRP |Price at Long Term Trendline support
Last major support to break
if 1900$ supports breaks down lower channel is the bottom
Untill then a bounce is possible here.
watch lower tf. Spot only order

Bitcoin & Ethereum same time currently rejecting on their LTF re
Bitcoin still struggling to break above on LTF resistance at 84.5k which is our cyan box range. 📉
Ethereum still continue doing ranging since from the recent breakout above on trend resistance white line which indicates the first sign for possible leg up but as of now buyers volume is not enough to produce a mini impulse up.
Patiently waiting again for this two major coin to confirm while some alts is popping aggressively upwards panda fam, Trade what you see not what you feel ✨

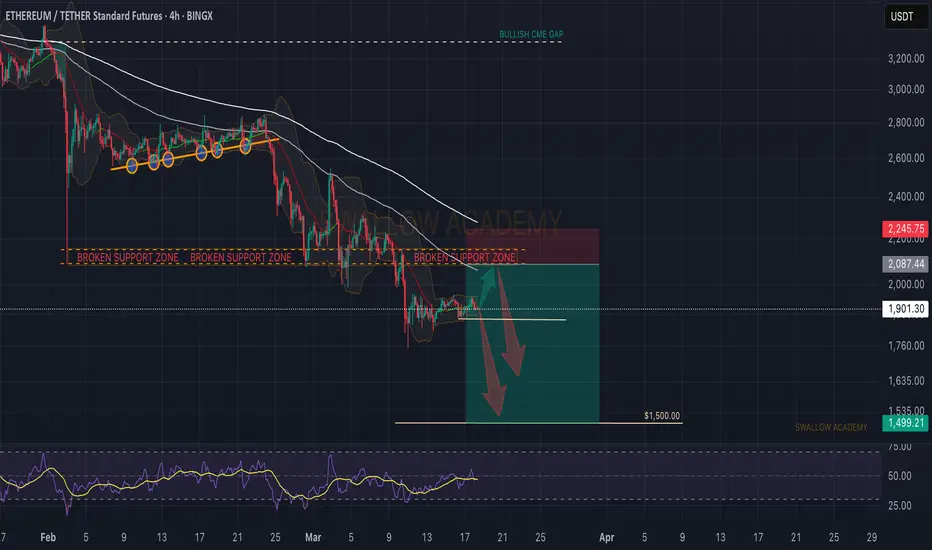
Ethereum (ETH): Hovering Near Support / Next Target $1,500.0Ethereum has been in the bloodpath for quite a while (since breaking down from a bullish trend), considering that we did not see a touch the ATH.
Now that price is below that bullish trend and we are still seeing no buying volume near the current support zone, we are expecting the $1,500.0 to be reached. Why that zone, you may ask? Well, big whales like round numbers and place their orders rather near round numbers, so this is the zone we are going to keep an eye on!
ETH still has potential, so let's keep an eye on, it. We expect the market dominance to flow into Ethereum soon!
Swallow Team

ETH is Trying to SurviveETH has formed a descending wedge formation which could help itself to climb a little bit more higher.
Breaking above the accumulation box could lead to an upwards move for ETH.
You can get a long position around 1950.
Good Luck.

Ethereum's Current Consolidation: Will It Move Up or Down...?BINANCE:ETHUSDT Ethereum Consolidating Between $1820 and $1950: Will It Break Upside or Downside..?
Ethereum has been trading in a consolidation range between the $1820 and $1950 levels since last week. As the price oscillates within this range, market participants eagerly await a breakout in either direction. The big question is: will Ethereum break upwards or downwards? Let's analyze two potential scenarios based on key price levels and liquidation points.
Scenario 1: Upside Breakout and Potential Rally
One key level to watch is the $1950 resistance. Ethereum has struggled to break past this level, but if the price manages to break above and sustain above $1950, there is a significant upside potential.
Why? At the $1994 level, there is approximately $1.16 billion in liquidations waiting to happen. If Ethereum pushes past the $1950 resistance and approaches this $1994 mark, the surge of liquidations could provide the momentum for a continued rally.
In this scenario, a good strategy would be to wait for a retest of the $1950 level as support, confirming the breakout. If the price holds above this level, it may be a good time to enter a long position, riding the potential bullish move.
Scenario 2: Downside Breakout and Further Decline
On the other hand, if Ethereum fails to hold above the $1820 support and breaks below this level, a downside move could be on the horizon. The next significant support lies around the $1785 level, where around $900 million in liquidations are waiting.
A break below $1820 could trigger a sharp decline toward this liquidation point at $1785. In this case, entering a short position after a retest of the $1820 resistance-turned-support could offer a solid opportunity for traders looking to capitalize on the downtrend.
Conclusion
Ethereum’s consolidation between the $1820 and $1950 levels presents two distinct scenarios. If the price breaks above $1950 and sustains that level, there is upside potential, with liquidation at $1994 offering a bullish catalyst. However, a break below $1820 could open the door for further downside, with liquidations at $1785 triggering a possible downtrend.
Traders should keep a close eye on these levels for confirmation and act accordingly based on the direction Ethereum takes in the coming days.

ETHUSDT – Bullish Breakout from Trendline, Eyeing Higher TargetEthereum has successfully broken out of the descending trendline, signaling potential bullish momentum. The price is currently holding within a strong support zone, which could act as a launchpad for further upside movement.
I expect the market to push higher towards the next key resistance levels. My target levels are set at $1,989.71, $2,155.17, and $2,267.42, while the stop-loss is positioned at $1,776.44 for risk management.
A retest of the breakout zone could provide an optimal entry before continuation to the upside. Watching for confirmation and volume increase to validate the move.

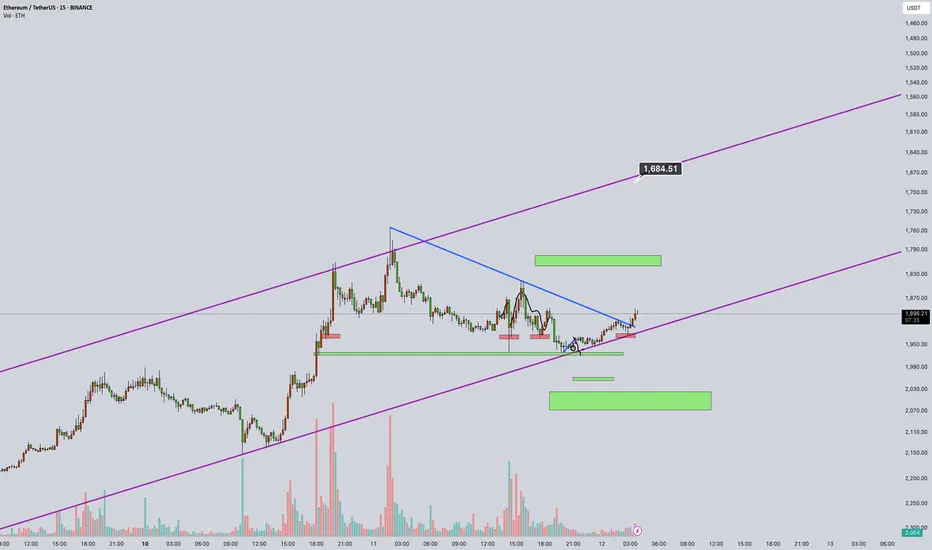
ETHEREUM ( SHORT TERM )Hello crypto community!
In this analysis, I’ve examined the Ethereum (ETH/USDT) 15M chart by inverting it.
It’s 12 March 2025, exactly 5 years since 12 March 2020, when Bitcoin crashed 55% in a single day, marking the “Black Thursday” that shook the market.
Now, the ETH chart shows the purple trendline as resistance (inverted to 1,684 USD) and green zones as support (inverted to 1,500-1,600 USD).
The pattern suggests a potential downturn; a break below the blue line could trigger a sharp pullback. Volume has risen by ~20% in the last hour, supporting this move.
Potential Scenario:
If resistance at 1,684 holds, the price may test support at 1,500-1,600, with a possible drop to 1,400. While not as severe as the 12 March 2020 crash, this week calls for caution. As a spot trader, I’m planning positions around the 1,600-1,500 range.
What do you think? Will ETH drop, or will the bull run continue? Share your thoughts below! 📉📈
ETH Price Prediction: Ready for a 94% Pump – A Key Breakout LoomThis chart highlights a critical moment for Ethereum (ETH). With a solid technical setup and clear indicators pointing towards a potential 94% pump, we're on the verge of a major breakout and then very strong retest point. Watch closely as ETH prepares to surge to new heights. Whether you're a long-term holder or a trader looking to capitalize on short-term gains, now is the time to pay attention. Stay sharp, the next move could be monumental.

New Down Rally For ETH📉 The ETHEREUM Sitting Above The Crucial Trend Line of a Bear Flag And My Expectation Is a Breakdown The Trend Line To The 1625$ Soon
By Breakdown From This Trend Line We Will Have a Another Down Rally For Alt Market

ETH/USDT – Ascending channel. Breakdown below support?Ethereum - is a smart contract platform that allows developers to build decentralized applications (DApps) on its blockchain.
CoinMarketCap : #2
↗️ Ethereum is moving within an ascending channel, and the bullish trend remains intact.
Inside the channel, there are two triangles.
The first triangle, with a base of 88%, has played out—its third wave broke through the triangle.
Liquidity grabs and shakeouts before the growth in the inner channel zones are marked with yellow circles.
Currently, we see a mirrored situation with a new triangle, this time with a 156% base. However, if this pattern plays out, it will break the ascending channel.
At the moment, the price has been dragged below the channel support, and there is a lot of negative sentiment in the news and opinions. Few believe in an upward move, and many have been liquidated. To me, this looks like a strong trigger.
⤵️The bearish scenario implies a -61% drop. (A less likely scenario.)
I've marked everything on the chart—consider this in your trading strategy. Remember, there's a lot of negativity around Ethereum, just like with all altcoins...
I also believe that on the monthly chart, it will end up being just a wick of the candle.

WHAT IS NEXT MOVE OF ETHUSDTETH/USDT 1D Time Frame Analysis indicates that the market has recently swept previous liquidity levels, resulting in a shift in trend towards the downside. As observed on the charts, the market is forming Lower Lows (LL), Lower Highs (LH), and Breaks of Structure (BOS) to the downside from the previous Fair Value Gaps (FVGs). The current market condition suggests that the price has already swept its previous lows. Based on this, the expected market movement may now trend upwards towards the identified CRT-H range.

AltSeason Begins If/When...Hello TradingView Family / Fellow Traders. This is Richard, also known as theSignalyst.
🔹 Let’s keep it simple and straightforward:
📈 Altseason begins if/when ETH breaks above its falling channel (in red) 📉 and the $2,000 round number.
⚠️ Meanwhile, further downside is expected.
📚 Always follow your trading plan regarding entry, risk management, and trade management.
Good luck!
All Strategies Are Good; If Managed Properly!
~Rich

ETH: The Final Dip Before LiftoffEthereum is gearing up for its final shakeout into the $1,602-$1,692 key zone. This could be the last chance to catch entries before a massive move up. Expecting a rapid breakout and, ultimately, a gap fill at $2,800.🚀
Entry: 1602-1692
TP: 2800
SL: 1495

ETHUSDT: Possible short setupETHUSDT: Possible short setup. Wait for a good rejection in the selected area for a short position.

ETH/USDT 1h chart reviewHello everyone, let's look at the 1H ETH chart to USDT, in this situation we can see how the price moves in the triangle from which we have an attempt to go out.
However, let's start by defining goals for the near future the price must face:
T1 = 1951 $
T2 = 1986 $
Т3 = 2032 $.
Let's go to Stop-Loss now in case of further declines on the market:
SL1 = 1905 $
SL2 = 1871 $
SL3 = $ 1846
SL4 = $ 1817

UniversOfSignals | Ethereum – The Never Ending Bear Trend?👋 Welcome to the UniversOfsignals channel!
Current Market Structure – Bearish Trend Dominates
Ethereum (ETH) is currently in a well-defined downtrend, consistently rejecting imbalance zones (highlighted in blue on the chart). Each time price reaches one of these zones, we see a rejection followed by a move lower. This has been a repeated pattern, confirming that sellers remain in control and that ETH is struggling to gain any meaningful bullish momentum.
The presence of a clear descending trendline further supports this bearish structure, as ETH continues to respect this resistance and fails to break higher. Until we see a strong shift in price action, the trend remains intact, and lower prices are likely.
Rejection of Imbalance Zones – No Bullish Confirmation Yet
The imbalance zones act as strong resistance, and so far, every attempt to push above them has resulted in rejection. This means that until one of these imbalance zones is invalidated (i.e., price breaks and holds above one), we cannot consider any bullish scenario.
Each rejection strengthens the bearish case, reinforcing the idea that ETH is likely to continue making lower lows and lower highs. Unless buyers step in with significant strength and push ETH beyond a key resistance level, the safest approach is to assume that the downtrend will continue.
When Can We Consider a Bullish Scenario?
For ETH to turn bullish, we need to see at least one of the following:
Breakout above an imbalance zone – This would indicate a shift in market structure and potential strength from buyers.
Higher highs and higher lows forming – A sign that momentum is shifting away from the current bearish trend.
Price reclaiming key resistance levels – If ETH can reclaim lost ground and sustain above it, it may indicate a potential reversal.
Until one of these conditions is met, there is no reason to be bullish. Any upside move that fails to break a key resistance should be considered a shorting opportunity rather than a bullish reversal.
Key Bearish Confirmation – Lower Prices Expected
As long as ETH keeps rejecting imbalance zones and making lower highs, the market structure remains bearish. The next downside targets are likely to be the previous support levels, with price potentially dropping towards the $1,600-$1,500 range if selling pressure continues.
The projected red price movement on the chart suggests that ETH could consolidate for a bit before continuing its descent. This aligns with the current trend and price behavior.
Historical Context – ETH at 2-Year Lows
ETH is currently trading at a price level last seen two years ago, reflecting significant weakness. Despite temporary rebounds, price action remains suppressed, and we are not seeing the kind of momentum that would indicate a strong recovery.
While some may view this as a “cheap” buying opportunity, the reality is that ETH is showing no bullish strength in its current price action. Without a confirmed trend reversal, simply being at a low price does not make it a good buy. Catching a falling knife is risky, and it is better to wait for confirmation before considering long positions.
Final Thoughts – Patience is Key
ETH remains in a strong bearish trend, and every rejection confirms lower prices.
No bullish confirmation yet – price needs to break a key level before we consider upside potential.
Expect further downside unless market structure changes.
ETH is at historical low levels, but low prices alone do not mean bullish momentum is coming.
As traders, the best approach is to wait for confirmation and trade with the trend. Until ETH proves otherwise, the bearish structure remains dominant, and downside targets remain in play.
__________________________________________
Thanks for your support!
If you found this idea helpful or learned something new, drop a like 👍 and leave a comment, I’d love to hear your thoughts! 🚀
Make sure to follow me for more price action insights, free indicators, and trading strategies. Let’s grow and trade smarter together! 📈
Also let me know if you want to see a chart of another coin. I will create it for you.
