Ethereum (ETH): Major Support Zone Being Tested and TestedEthereum is still hovering near the local support zone, where we have had a lot of touches to that zone so far, giving us multiple good setups on Ethereum.
Now we are waiting... waiting for more clarity to see who will take over the current zone and dominate it, as this is the key zone for now.
If we see buyers dominating, then the target would be the 200 EMA line, but if we see sellers taking over control and breaking the support zone, then we will be in the "free-fall" zone.
Swallow Team
ETHBULLUSDT trade ideas

ETHUSDT (Ethereum) Using Elliott Waves: Back to 1K? Plotting waves on Ethereum: The current correction may be a larger degree wave (2) or a wave (4) consolidation. Taking either would depend on the analyst's bias.
In both the cases, what matters is spotting the corrective patterns and participating in the larger impulses.
The June'22 bottom is a relevant one as many coins bottomed out then. But have we made a long term bottom on ETH or not? This upmove on Ethereum does not seem impulsive in the eyes of EW. With the trendline broken and monthly RSI going for a reset, the alt season may not be here anytime soon.
If this move is supported, we can see a sharp decline in the coming months taking the price back to 1K (or slightly below). The political interference on crypto can keep giving random shakeouts so it is important to keep a firm view on either side. Until the price remains below 3K, I would like to keep my bearish view.

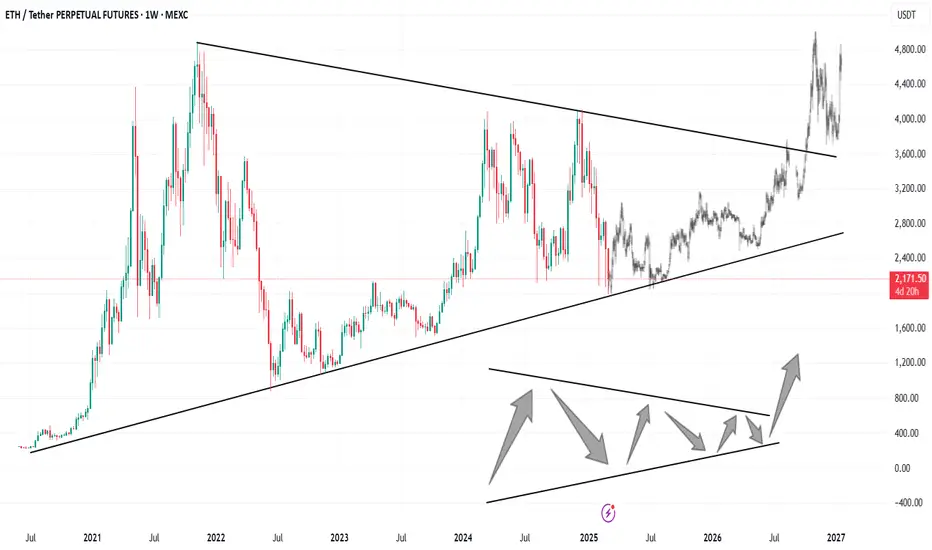
Ethereum creating a multiple year symmetrical triangle!?! Hello Everyone, I am LiquidMex here to share my opinion on the weekly Ethereum chart.
What is a symmetrical triangle?!?
A symmetrical triangle is a common chart pattern in technical analysis. It occurs when the price of an asset fluctuates within a narrow range, forming two converging trendlines. The upper trendline connects a series of lower highs, while the lower trendline joins a sequence of higher lows
As the price of Eth declines so does the chance of Ethereum recovering to break all-time highs, President Trump announced a Crypto Reserve listing Ethereum as one of the 5 coins in the Crypto reserve. We saw a nice pump in price the day of announcing the Crypto Reserve followed by a continuation of a sell off.
Key level of support $1,980
The Key level to stay above is around $1,980 breaking below that key level would result in a crash ultimately down to the $1,500's
This key level of support is critical that it holds as if it does hold i would assume in the chart depicted above we would create a Symmetrical Triangle. I would expect Ethereum to have a breakout of the symmetrical triangle within the next 500 days.
Currently the overall crypto markets look uncertain i personally believe we have started a 1.5 year bear market i don't think we will go much lower but i do believe there will be alot of sideways price action for months to come.
If you found value in my technical analysis Ethereum make sure to smash that like button and give me a follow.
ether long , the storm will pass, greet the spring pattern will be completed, soon or later the support will push the price

ETH NEW ANALYSIS (1D)A more comprehensive analysis for Ethereum is as follows:
It seems that wave E of our Diametric is nearing completion. For wave F, Ethereum should experience upward retracements and spend some time consolidating.
The best zone for the completion of wave E is marked on the chart as the upper green box.
The optimal rejection area for price to move downward and complete wave F is marked by the red circle. Now, we wait to see whether the price reaches this zone for wave F or not.
Wave G may have two potential targets: either the upper or lower green box at the bottom of the chart.
For risk management, please don't forget stop loss and capital management
Comment if you have any questions
Thank You

Ethereum Crash Or New All-Time High? Ready For Action!The market is giving you a second chance and this is great. This is a short-term retrace, a pull-back, call it whatever, but we know what happens next.
Market conditions do not change to the bearish side after a strong bullish jump. The chart was bullish before the breakout, the chart will become even stronger once the LONG squeeze is over. It seems too many people entered Ethereum on a reaction, the market is making them pay.
Is the action over? Is Ethereum set for lower prices and lower low?
Not likely, market conditions stay the same.
The Ethereum chart doesn't look great on the 2D timeframe, but this doesn't change the dynamics in relation to the rest of the market. What ones does, the world follows. Ethereum doesn't move in a vacuum. We are so blessed to get a second chance in case we missed the first one.
Ethereum is ready. Ethereum is good. Ethereum is going up.
Think of the dynamics of last week. Most of the week was red but the action ended green. This time it will be different, we are likely to see red only the first 1-3 days, the rest of the week we are likely to get green and move up. Once the current level is gone it is gone for good. Nobody will be able to enter with high lev. and keep a position. This is the last chance for a bottom price before the full blown bull-market and the final late 2025 bull-market bull-run.
This is a friendly reminder. Hold strong. PANIC HOLD!
Whatever you do, keep your Crypto, keep your Bitcoins, keep your Ether, it is all going up.
What difference does it make to wait a few days when the reward at the end of the cycle is so much?
The waiting will seen like nothing once you are face to face with the results.
Cryptocurrency is going up massively in 2025.
Don't lose heart. Do not be nervous or anxious, there is no stopping what the market has in store for us.
If you are reading this now, you have great timing, you are blessed, we are looking at bottom prices before a massive, really massive, bullish phase.
Thank you for reading.
Namaste.

ETH - Short term long I have just entered on the breakout (Assuming it closes above 2110 on the 1H.) Target $2250.

ETHEREUM COIN ANALYSIS AND NEXT POSSIBLE MOVES!!CRYPTOCAP:ETH Coin Update!!
• Technically Overall CRYPTOCAP:ETH Structure look Bearish.
• Two major support areas are marked on a chart.. ( First Support 1950$-1880$ ) & ( 2nd support is 1550$ )
• Where you are able to add CRYPTOCAP:ETH For Long-term in your Portfolio & Also you are able to build trade setups on it... If price respect these levels🫡
Warning : DYOR Before taking any action🚨

shortEthereum is expected to face a greater decline than Bitcoin. With the markets closing below the $2,100 mark, it's likely that ETH could drop further, potentially reaching around $250 in the coming months.
There is also a possibility of panic selling, which could accelerate these downward price movements. In light of this, attempting to buy or average down on this pair would be highly risky and could lead to significant losses.

Trading Update – ETH/USD – Lord MEDZ Ethereum has tapped into a key breaker block on the weekly timeframe. This level has historically acted as a springboard for major moves. The confluence of demand in this zone suggests a high-probability reversal setup in play.
Support Zone: $1,795 - $1,832 (Order Block)
Current Price: $2,074
Target: $4,093+ (97% upside potential)
Stop Loss: $1,795 (Risk ~13.45%)
Risk/Reward Ratio: 7.23
Worst case, if the breaker fails then we could see a test of the order block below.
The strategic cryptocurrency reserves by the money-printing machine (USA) add another layer to this thesis. This could be the shakeout before the next major rally.
Stay patient, manage risk, and let price action confirm the move.

WHATS NEXT FOR ETHEREUM;Ethereum had a clean pullback to the lost support line and is now on the verge of losing $2K. If it’s lost, which is likely to happen, $1400-$1600 will be the last resort before the price reaches $1K. However, bulls might kick in when the price reaches there.
So, two scenarios: $1500 will likely be touched soon, marking the end of this bear cycle. Alternatively, Ethereum could lose that support too after a pullback to the lost $2K support, and in that case, $800-$1000 is the price range you should start buying at, the price I'm expecting since a couple months ago and peope used to mock my analysis, welp jokes on you ;3
Let's not even think about the new potential lows for alts they are mostly going to crash :cc

How should we analyze ETHUSDT? I have written about the reasons Ethereum has been the most talked-about asset during this downturn.
↪ Each time it showed a decline, the drop was sharp and rapid, consistently forming new lows. As a result, it has significantly lost trust among retail investors who were primarily focused on buying.
Here is the daily chart of Ethereum.
The overall structure and range are formed using two supply zones as key levels along with a single range.
I am currently using two key levels as my primary reference:
1. The support zone that held during the decline in early February.
2. The resistance zone that formed when the previous low was broken.
✔ Despite the new low being established, I have set the range as shown above because it is still too early to confirm a complete breakdown of the lower range.
✔ As shown in the chart above, we have yet to see a full-body candle close below the lower range. Additionally, the key level at the bottom continues to provide support.
If we do see a decisive full-body close below the lower range and the key level no longer holds as support, we can conclude that the liquidity sweep at the lower range has failed to remove sufficient liquidity.
A Range Sweep typically occurs when there is a well-defined range with clear highs and lows. It refers to a scenario where price temporarily breaks out (or breaks down) beyond this range but closes back inside, leaving a wick.
This movement goes by different names, such as Range Sweep, Stop Hunt, and Fake Out, but they all serve a distinct purpose.
The Role of Smart Money in Liquidity Sweeps
Market-controlling entities, often referred to as Smart Money, tend to move in the opposite direction of retail traders. Their primary objective is to eliminate as many retail positions (liquidity) as possible before triggering a sharp price reversal.
Retail traders generally follow simple trading patterns:
• They tend to chase price moves, entering long positions as the price rises and short positions as it falls.
• They often place stop-loss orders at the most recent swing high (for shorts) or swing low (for longs).
Smart Money exploits this predictable behavior by targeting these stop-loss orders to clear liquidity and then reversing the price direction.
Key Liquidity Concepts
• BSL (Buy-Side Liquidity): Liquidity from short positions’ stop-loss orders resting above key highs. If price touches these levels, a reversal may occur.
• SSL (Sell-Side Liquidity): Liquidity from long positions’ stop-loss orders resting below key lows. If price touches these levels, a reversal may occur.
Liquidity Sweep in Action
Liquidity sweeps follow this mechanism:
1. Price breaches a key level (either a high or a low).
2. Stop-loss orders trigger, increasing liquidity.
3. Smart Money absorbs liquidity and reverses price direction.
Understanding this concept and identifying liquidity sweeps in real-time can significantly enhance your market analysis and trading strategies. Keep an eye on these setups, as they can provide high-probability trade opportunities.
The explanation about liquidity sweeps became a bit lengthy in the middle.
Ultimately, I still see Ethereum’s current price action near the daily low as part of an ongoing liquidity removal process. If it breaks above the trendline resistance and the key level within the internal range supply zone, signaling a trend shift, we could target a move up to the range high of $4,100.
▩ Key Takeaways from This Perspective: The Method and Purpose of Liquidity Sweeps
To successfully trade the movements that follow liquidity sweeps, it’s crucial to understand that positions should not be taken during the liquidity removal process itself.
If liquidity is being swept on a higher time frame (HTF), the top-down analysis approach should be used to identify reversal price action on the middle and lower time frames (MTF, LTF) before entering a trade.
In my next analysis, I will likely discuss how to correctly follow price reversals after liquidity sweeps and how to position accordingly.
Thank you.

Eth back into the rangeETH has been weak and got a lot of hate for sure. But according to the chart, it did took the low,, and come back within the range.
If we get market structure shift here, why not go higher?

ETH - Let's gooo!🚨 CRYPTOCAP:ETH is at a make-or-break zone! 🚨
This level is crucial as it aligns with the lower bound of the channel & the key $2,000 round number.
✅ Holding $2,000? A bullish move toward $2,500 is on the table! 📈
❌ Losing $2,000? More downside risk ahead.
#ETH #Crypto #Ethereum
Disclaimer:
This content is for informational purposes only and should not be considered financial or investment advice. Always do your own research and consult with a professional before making any investment decisions.
Reversal ZoneThe reversal zone has been identified based on volume and Fibonacci levels, and the likelihood of a reversal in these areas is high. Please note that trading in this zone requires the use of appropriate tools to obtain confirmations. This is solely an analysis and not a financial or trading recommendation. The responsibility for any risks taken lies with the readers. Wishing you success.

EthusdLast port of call for bullish markets..
Trumponomics tanking stocks and crypto here
Many bullish catalysts but the trade tarriff and warmongering sending fear shockwaves through every market rn
Openly calling democratically elected leader zelensly a dictator whilst siding with Putin an actual dictator leaving ww3 fears at the top of people's minds... As well as a complete mistrust, talks of insider trading among other things sigh* endorcing complete grift cryptos and ignoring real ones..
In other news north Korean group Lazarus has successfully washed their hacked eth through thorchain
Complete volatile chaos here and could be the start of a global recession if we can't regain 2023 levels soon...
I'm personally of the opinion that it will reclaim and there will be a crypto reserve for USA but it looks pretty bad today..

ETH update#ETH in long term analysis has a very huge triangle with 5 waves like ABCDE i think this market is based on elliot waves so now we are in the 5th wave

Check if it can rise above the long-term uptrend line (1)
Hello, traders.
If you "Follow", you can always get new information quickly.
Please also click "Boost".
Have a nice day today.
-------------------------------------
(ETHUSDT 1D chart)
In order to turn into an uptrend, the price must rise at least above the long-term uptrend line (1) and maintain the price.
Accordingly, the key is whether there is support near the 2706.15-2879.90 section.
If not, and it falls, the key is whether there is support near 2403.24.
The reason is that it has fallen from the long-term uptrend line (1) and is located below the M-Signal indicator on the 1D, 1W, and 1M charts.
Then, you need to be careful because there is a possibility of a step downtrend.
-
Thank you for reading to the end.
I hope you have a successful trade.
--------------------------------------------------
- Big picture
I used TradingView's INDEX chart to check the entire range of BTC.
(BTCUSD 12M chart)
Looking at the big picture, it seems to have been maintaining an upward trend following a pattern since 2015.
In other words, it is a pattern that maintains a 3-year uptrend and faces a 1-year downtrend.
Accordingly, the uptrend is expected to continue until 2025.
-
(LOG chart)
Looking at the LOG chart, you can see that the uptrend is decreasing.
Accordingly, the 46K-48K range is expected to be a very important support and resistance range from a long-term perspective.
Therefore, it is expected that prices below 44K-48K will not be seen in the future.
-
The Fibonacci ratio on the left is the Fibonacci ratio of the uptrend that started in 2015.
In other words, it is the Fibonacci ratio of the first wave of the uptrend.
The Fibonacci ratio on the right is the Fibonacci ratio of the uptrend that started in 2019.
Therefore, it is expected that this Fibonacci ratio will be used until 2026.
-
No matter what anyone says, the chart has already been created and is already moving.
It is up to you how to view and respond to this.
If the ATH is renewed, there are no support and resistance points, so the Fibonacci ratio can be appropriately utilized.
However, although the Fibonacci ratio is useful for chart analysis, it is ambiguous to use it as support and resistance.
The reason is that the user must directly select the important selection points required to generate Fibonacci.
Therefore, since it is expressed differently depending on how the user specifies the selection points, it can be useful for chart analysis, but it can be seen as ambiguous to use it for trading strategies.
1st: 44234.54
2nd: 61383.23
3rd: 89126.41
101875.70-106275.10 (when overshooting)
4th: 134018.28
151166.97-157451.83 (when overshooting)
5th: 178910.15
-----------------

#ETH/USDT Analysis📉 CRYPTOCAP:ETH is looking weaker than CRYPTOCAP:BTC , now approaching the 4H IFVG.
⚠️ Needs to hold this level, or new lows could be on the table.
🔍 Still bearish—waiting for SMT confirmation before considering longs.
Watching closely!👀

Ethereum Market Analysis–Bearish Breakdown Signals Further RiskKey Developments & Price Action:
Ethereum lost its key support at $2,400 and has dropped 21% over the past week, following widespread crypto market declines.
ETH is now in a vulnerable position, struggling to find stability after this sharp sell-off.
Critical Support & Downside Risks:
The $2,000 psychological level is crucial—if ETH fails to hold above it, further downside pressure is likely.
The next major support is at $1,800, a level last seen during the 2023 bear market.
A sustained move below $2,000 could confirm a bearish market structure, increasing the probability of continued selling pressure.
Potential Scenarios:
Bullish Case: ETH stabilizes above $2,000 and begins a relief bounce toward $2,200–$2,400, reclaiming lost support levels.
Bearish Case: ETH breaks below $2,000, confirming a deeper correction, with $1,800 as the next downside target.
Market Outlook:
For now, Ethereum remains bearish and requires strong buyer support at $2,000 to avoid a deeper sell-off.
A weekly close below $2,000 would signal further weakness, while a rebound above $2,400 would help regain bullish momentum.
Caution is warranted until ETH confirms a clear bottom formation.

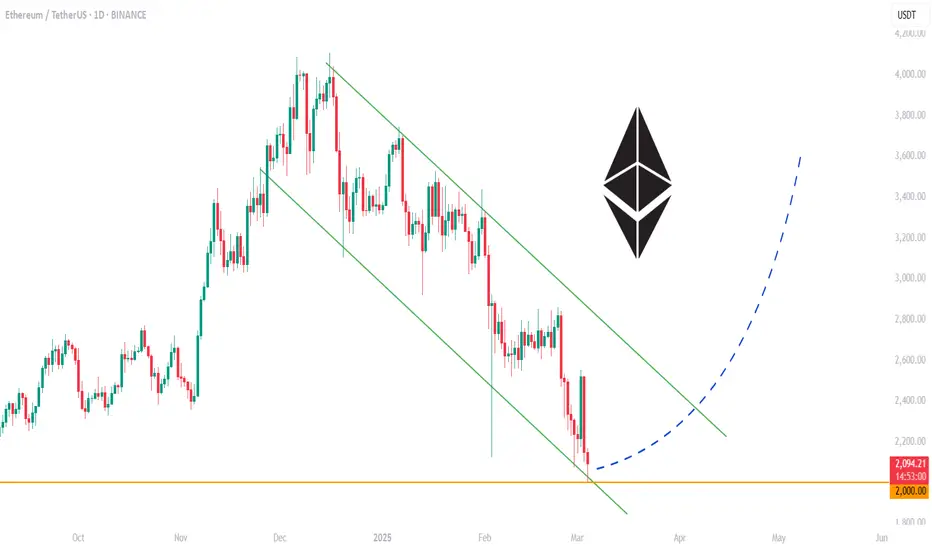
ETH, Next Stop => $2,750Hello TradingView Family / Fellow Traders. This is Richard, also known as theSignalyst.
📌 ETH rejected the lower bound of the falling channel and the $2,100 - $2,250 support zone.
What’s next?
ETH remains in a correction phase, and a move toward the upper bound of the channel at $2,750 is expected.
🏹 As it retests the support zone, we will be looking for new short-term long opportunities.
📚 Always follow your trading plan regarding entry, risk management, and trade management.
Good luck!
All Strategies Are Good; If Managed Properly!
~Rich

Ethereum (ETH): Target Has Been Reached / Major Zone!!We are at the major zones with Ethereum where we reached our target zone.
Now this is the breakpoint for us, as if we see a further breakdown from here, then Ethereum will see a very nasty further fall from here.
Logically, we should see at least some kind of recovery from here, but let's see. We gotta wait for more confirmations!
Swallow Team

Ethereum (ETH): Weakness On Every CornerEthereum is bad, unwell, and very bad. While logically we need to see an uprise of the Ethereum ecosystem, we see only blood and red on the markets where each push we get sellers overtaking and dominating.
But we are going to see it as another opportunity to buy in; we might fall more here and even as low as $1750 or $1800 but keep in mind we did not reach the ATH on Ethereum when all that bullish movement happened... liquidity has to move somewhere and we think it will move here!
Swallow Team
