ETHUSDT - Limited Return PriceEthereum is a reliable network for financial transfers and transactions and can be considered the second most popular digital currency after Bitcoin. Currently, this currency has reached the price range of $2,500 with temporary decreases, but this price is at its lowest level and the probability of liquidity entering this price area is very high. This price level can be used for long-term investment. I specify two targets for this price area: $4,000-5,000.
Sasha Charkhchian
ETHBULLUSDT trade ideas

Ethereum Faces Market Liquidation—Is There Hope for a Rebound?Ethereum is caught in the storm, plunging 9.50% in just 24 hours as liquidations grip the crypto market. With trading volume up 68.73% to $42.79 billion, it's clear that volatility has taken over. Over the past week, ETH has lost 8.08%, and in the last 30 days, it's down a staggering 27.67%.
With ETH now at a market cap of $291.3 billion, its dominance has slipped to 10.17%, reflecting the growing uncertainty.
Warning Signs from the Charts
🔹 Death Cross (EMA 50/200) – A strong bearish indicator that signals extended downside risk.
🔹 RSI Nearing Oversold – ETH is rapidly approaching critical buying zones, but will traders step in?
What’s Next for Ethereum?
📌 Bullish Case – If buyers return, ETH could push toward $2,870, reclaiming lost ground.
📌 Bearish Case – If market fear lingers, Ethereum could tumble toward $2,175, its next major support level.
Ethereum’s short-term fate hinges on whether bulls can counteract selling pressure. While uncertainty remains high, a rebound could be brewing if buyers step in at key support levels.
So, does hope spring eternal for ETH, or is more downside ahead?

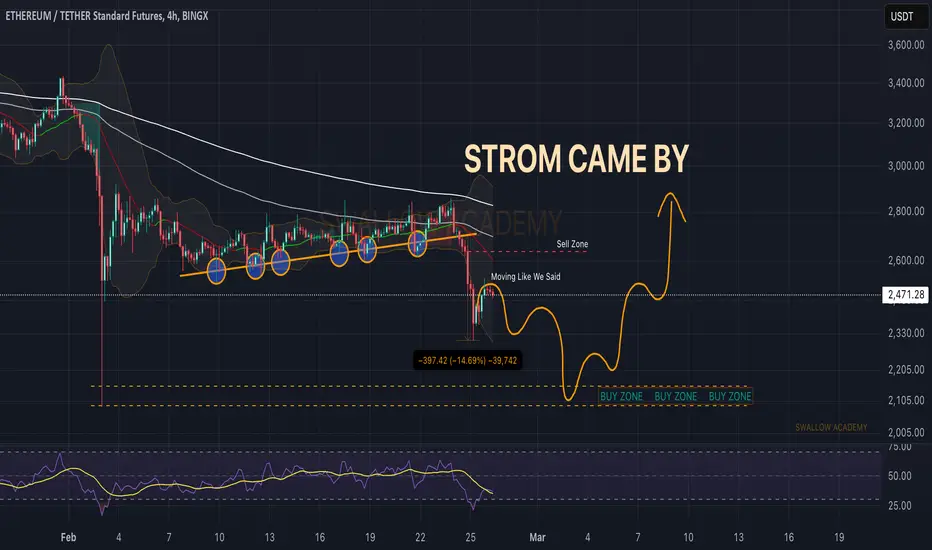
Ethereum (ETH): Smaller Correction + Further DipEthereum has been moving just as we need—a proper breakdown + smaller correction—and now ready for another round, it seems.
We are looking for a price to reach our lower target zone of $2000, which would be our buy zone as well so keep an eye on it!
Swallow Team
ETH/USDTOn the chart, we observe that the ETH/USDT pair is moving within a descending channel and is trading below the 20, 50, 100, and 200-day moving averages. This view confirms that the overall trend is weak.
The areas highlighted in red are Order Block (OB) zones where heavy institutional buy/sell orders were executed in the past. In particular, the $2160 level on the demand side has previously acted as critical support where the price received a strong reaction. If the price holds in this zone, a short-term rally toward the upper band of the descending channel could be seen. However, if the OB zone breaks to the downside, the decline might deepen and new lows could be tested.
The RSI indicator is currently neutral, so it does not signal overbought or oversold conditions.
Since the MACD continues to remain in negative territory, there is not yet a strong bullish momentum signal.
Additionally, due to the lack of a significant increase in volume, additional catalysts are needed to expect a sharp change in market direction in the short term.
In summary, if the OB zone is maintained, the likelihood of an upward correction increases. Otherwise, selling pressure may intensify, and if a daily candlestick closes below the demand support line, the $2160 level should be used as a stop-loss. It is important to use stop-loss and similar risk management methods in both bullish and bearish scenarios.

Is Ethereum Ready to Bounce from the Channel Low?
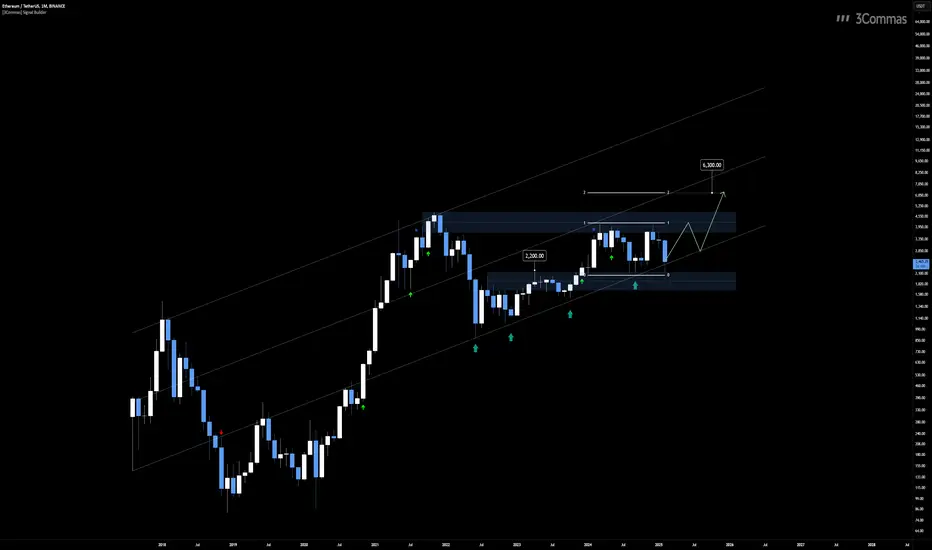
The BINANCE:ETHUSDT BITSTAMP:ETHUSD chart shows Ethereum trading near the lower boundary of the ascending parallel channel, with the $2,200 level serving as a key support zone. This area is particularly significant as it aligns with previous resistance turned support, making it an attractive entry point for long-term buyers.
Historically, ETH has respected this lower channel trendline, bouncing off it on multiple occasions. The current price action suggests that the pattern remains intact, reinforcing the possibility of another upward move from this region.
If the price holds and momentum builds, projecting the width of the current consolidation channel gives an estimated upside target near the $6,300 level. This aligns with the channel’s upper boundary and represents a potential long-term target should the bullish scenario unfold.
👨🏻💻💭 What’s your plan? Will ETH hold $2,200 and climb toward $6,300, or is more consolidation ahead? Share your thoughts and let’s discuss potential strategies!
__
The information and publications within the 3Commas TradingView account are not meant to be and do not constitute financial, investment, trading, or other types of advice or recommendations supplied or endorsed by 3Commas and any of the parties acting on behalf of 3Commas, including its employees, contractors, ambassadors, etc.
The bearish scenario for Ethereum is now active (1D)We have always relied on the flip zone from our previous Ethereum analyses. Now that this zone has been broken, the bearish scenario for Ethereum is active.
A more accurate interpretation suggests that this is the correct structure. Given this, we have been in Ethereum's bearish Wave C for some time.
Ethereum is expected to move from the red zone toward the green zone soon.
For risk management, please don't forget stop loss and capital management
Comment if you have any questions
Thank You

ETH and bybit's Hack impactDespite Bybit’s hack that resulted in $1.4B of ETH being stolen, its strong marketing and support from other exchanges suggest that additional selling pressure may be limited. However, Vitalik’s hints at a possible rollback could pose significant risks to the Ethereum network. I'm still bullish on ETH for next week, and the position you see here is my trading idea. Good luck!

ETHUSDT 1WETH ~ 1W Analysis
#ETH We hope this support will continue to be maintained. To continue to maintain the dominance of the bull.

ETH Analysis (SMC)After yesterday's breakdown, I think price can recover itself and fill imbalance gap that create. Also fibo can be good resistance zone for price, if price through fibo zone, waiting for CHoCH.

The key is whether it can rise above 2674.15
Hello, traders.
If you "Follow", you can always get new information quickly.
Please also click "Boost".
Have a nice day today.
-------------------------------------
(ETHUSDT 1M chart)
The key is whether it can receive support near the important support and resistance area of 2513.01-2706.15 and rise above the M-Signal indicator on the 1M chart.
If it fails to rise, you need to stop trading and check the situation.
The reason is that there is a high possibility of further decline.
-
(1W chart)
In order to turn into an uptrend, it is expected that the price will have to rise above 2706.15 at least to maintain it.
The reason is that the M-Signal indicators on the 1W and 1M charts are likely to cross near that point.
If it falls below 2316.10, it is likely to fall until it meets the HA-Low indicator.
Since the HA-Low indicator is likely to be newly created as the price falls, it is important to see if there is support near it if it is newly created.
The HA-Low indicator is currently formed at 1340.12.
-
(1D chart)
The key is whether it can find support near 2316.10-2513.01 and rise above 2674.15.
If it fails to rise, it is likely to show a step-down trend.
Since it has currently fallen below the M-Signal indicator of the 1M chart, it can be seen as a downward trend from a long-term perspective.
However, since the transaction with the M-Signal indicator of the 1M chart is not far away, it is thought that it is likely to rise.
Therefore, the HA-Low indicator point of 2674.15 is likely to be the high point of the rebound.
-
Basically, the time when we can trade is when the price rises above the M-Signal indicator of the 1D chart and maintains the price.
And, when the M-Signal indicators of the 1W and 1M charts are aligned.
Otherwise, the transaction must be short and quick.
When the downtrend begins during spot trading, it becomes busy.
The reason is that we need to increase the holding quantity.
There are two ways to increase the number of holdings: investing a lot of money to buy, and increasing the number of coins (tokens) corresponding to the profit.
If you have a lot of cash or about 20% of the total investment, you can use the method of buying when the M-Signal indicator on the 1D chart rises above the level and making a profit.
-
If you have little or no cash, you will eventually have to sell the coins (tokens) you currently have and buy them again to increase the number of holdings.
In other words, when there is a rebound, you should sell part of the purchase principal, and when there is a decline, you should buy back the amount you sold.
The ultimate goal of this method is to recover all of the purchase principal and hold the remaining number of coins (tokens).
I think there is no better way for long-term investment.
-
Thank you for reading to the end.
I hope you have a successful transaction.
--------------------------------------------------
- Big picture
I used TradingView's INDEX chart to check the entire range of BTC.
(BTCUSD 12M chart)
Looking at the big picture, it seems to have been maintaining an upward trend following a pattern since 2015.
In other words, it is a pattern that maintains a 3-year upward trend and faces a 1-year downward trend.
Accordingly, the upward trend is expected to continue until 2025.
-
(LOG chart)
Looking at the LOG chart, you can see that the upward trend is decreasing.
Accordingly, the 46K-48K range is expected to be a very important support and resistance range from a long-term perspective.
Therefore, I expect that we will not see prices below 44K-48K in the future.
-
The Fibonacci ratio on the left is the Fibonacci ratio of the uptrend that started in 2015.
That is, the Fibonacci ratio of the first wave of the uptrend.
The Fibonacci ratio on the right is the Fibonacci ratio of the uptrend that started in 2019.
Therefore, this Fibonacci ratio is expected to be used until 2026.
-
No matter what anyone says, the chart has already been created and is already moving.
It is up to you how to view and respond to it.
Since there is no support or resistance point when the ATH is updated, the Fibonacci ratio can be appropriately utilized.
However, although the Fibonacci ratio is useful for chart analysis, it is ambiguous to use it as a support and resistance role.
The reason is that the user must directly select the important selection points required to create the Fibonacci.
Therefore, it can be useful for chart analysis because it is expressed differently depending on how the user specifies the selection point, but it can be seen as ambiguous for use in trading strategies.
1st: 44234.54
2nd: 61383.23
3rd: 89126.41
101875.70-106275.10 (when overshooting)
4th: 134018.28
151166.97-157451.83 (when overshooting)
5th: 178910.15
-----------------

Bull Market Started. GO UP ETHThe 2300 region that I have been waiting for a long time has finally come again. While BTC is falling, ETH is now looking stronger. A nice bottom structure has formed in ETHBTC. I think the bull market has started and the rise is coming from here. I am adding to my ETH contracts by the end of April.

ETHUSDT TECHNICAL ANALYSIS NEXT MOVE POSSIBLE CHECK CAPTAIN This chart represents an analysis of Ethereum (ETH) against Tether (USDT) on a 1-hour timeframe from Binance. Here’s a breakdown of the key elements:
1. Price Action & Trendlines
The chart shows previous ascending channels (marked in blue) that led to a breakdown.
The price recently dropped sharply after breaking below a key resistance zone.
2. Support & Resistance Zones
The red zone around $2,621.45 indicates a resistance level where price may struggle to break through.
The green zone around $2,724.32 suggests a target level if price breaks resistance.
3. Fibonacci & Technical Indicators
Concentric circles in red and blue suggest Fibonacci-based confluence levels.
The price has reached a potential support level (marked with the lightning bolt icon), suggesting a possible reversal.
4. Projected Movement
The black arrow suggests a bullish rebound from $2,423.12, targeting $2,621.45 first.
If price breaks the resistance, it could move toward $2,724.32.
Conclusion
The chart predicts a potential bullish recovery, but confirmation is needed with price action at $2,423. If ETH holds this support, it may rally toward $2,621 and higher. However, if it fails, further downside is possible.
Would you like me to analyze this further or suggest a trading approach?

$ETH/USDT Trading IdeaIf Ethereum support holds, I’ll be happy. All I need is for $2,200-$2,300 to be respected. That would be perfect. God bless my soul. Look at the previous -30% drop on the left side. This could be a similar setup. A double-check on support, then a rally to retest $4,000? Let’s hope!

ETHUSDT MMC structure ETH/USDT has broken the key resistance level (“peanut”), and the last recorded supply stands at 1857. The central zone, or the 50% supply level, is at 2287, where ETH is currently holding. If it maintains this level, the next target will be the last demand zone at 2596.

As Long As Long ETH Playing Below 2760$ My Priority Is Bearish 📊 There Is Nothing New Happened About ETH And The Price Is Still Playing In Range
👉 Today The Price Hit 2760$ Resistance Level One More Time And Rejected Again, Totally We Are In a Crucial Situation, 2760$ And 2650$ Are Important Levels For Future Trend Of The Market And As Long As The Price Playing Below 2760$ My Priority Is Bearish

Ethereum (ETH): Sellers Are Taking Over $2000 Incoming...Well, sellers took over the local push we had here and broke the supportive trend, resulting in a decent drop as well.
As our upper buy entry failed, we are going to look for lower zones to be reached now, which are in the $2000 area.
From there we will be looking for some kind of BoS to form on smallertimeframes and overtake of buying volume so, we expect a further drop for now.
Swallow Team

Etherium bullishSupport is not where you become bearish and start selling , it is the opposite.
Soon we will witness a major shift in this bull run .
Do not get shaken out , if u scared just look at the previous bull runs , we had bigger corrections and crypto pulled them back like they did not occur.

Ethereum 2000$ INCOMING!!!According to range trading rule on Ethereum, sweep and reclaim of range low at ethereum is expected which will finally make alts to boom

Ethereum (ETH/USDT) Analysis: TF30
Ethereum (ETH/USDT) Analysis:
📊 Current Price: $2,492.32 (Down -8.52% in 24h)
🔍 Technical Analysis:
1. Short-Term Trend:
- Significant price correction
- Bearish short-term momentum
- Testing key support levels
2. Key Levels:
- Support: $2,461.52
- Resistance: $2,735.15
- 24h Range: Low $2,461.52 - High $2,735.15
- All-Time High: $4,891.70
3. Market Indicators:
- Market Cap: $300.51B
- 24h Trading Volume: $30.18B
- Circulating Supply: 120.57M
🎯 Trading Recommendations:
- Strategy: Cautious, Wait-and-Watch
- Potential Entry: $2,500 - $2,550
- Stop Loss: $2,400
- Take Profit: $2,700
⚠️ Risk Management:
- Reduce exposure during high volatility
- Monitor Pectra upgrade developments
- Watch for trend reversal signals
🔮 Market Outlook:
- Short-term bearish sentiment
- Potential consolidation phase
- Long-term fundamentals remain strong
💡 Key Factors:
- Recent price correction
- Upcoming Pectra upgrade
- Overall crypto market conditions

#ETH reaches target zone📊#ETH reaches target zone✔️
🧠We tested the resistance zone 2820-2840 again. Although it broke through, it did not stabilize, so we tried to participate in some short trades in this resistance zone. Fortunately, everything went well. Now it has reached the support zone near 2646-2686. You can lock in major profits and look forward to more.
➡️From the perspective of the chart, near the lower edge of the symmetrical triangle, we need to pay attention to the support here to decide whether to participate in long trades instead of chasing shorts here.
Let's see👀
🤜If you like my analysis, please like💖 and share💬
BITGET:ETHUSDT.P

ETH have not touched prevoius ATHTrump and his family hold a lot of ETH, then why should we ignore it?
current price haven't close below trend line of uptrend and if it breaks i don't think it will dump so much.

BTC Heading Towards 88K, Then Dropping to 72K-75K – ETH Outlook📌 BTC Heading Towards 88K, Then Dropping to 72K-75K – ETH Outlook
📉 ETH Trend Analysis:
🔹 Weak momentum in the larger cycle
🔹 Recent price increase is likely a corrective move before another drop
📊 Key Levels for This Week:
🔼 Resistance: $2975
🔽 Support 1: $2400
🔽 Support 2: $2100
🚨 Trading Strategy (Next 1-2 Weeks):
✅ Sell priority – Align with the broader market downtrend
✅ BTC & total market cap declining – Expect gradual downside moves
⚠️ Buy only at key levels – Best for scalping trades
Trade smart! 🚀📉

Ethereum — 2025. The Lord Giveth and Taketh Away (Caution! 18+)Donald Trump's recent policies and statements have generated significant negative sentiment towards Ethereum and the broader cryptocurrency market. As he resumes the presidency, his administration's approach to cryptocurrencies is expected to be more regulatory and cautious, which could impact Ethereum investors.
Historical Context of Trump's Views on Cryptocurrency
Trump has a mixed history with cryptocurrencies, as we mentioned in earlier published ideas. Initially, he labeled them a "scam", "based on thin air" as well as "threat to the U.S. dollar" and expressed skepticism about their value, stating that they are not real money and are highly volatile. However, in recent months, he has shifted his stance somewhat, reportedly owning between $1 million and $5 million in Ethereum as of August 2024. Despite this personal investment, his public comments continue to reflect a critical view of the crypto market.
Impact of Recent Tariffs on Ethereum
The most immediate cause of concern for Ethereum investors has been Trump's announcement of new tariffs on imports from Canada, Mexico, and China. This decision triggered a significant sell-off in the cryptocurrency market, with Ethereum experiencing a drastic price drop of over 26% in just one day. The overall cryptocurrency market lost nearly half a trillion dollars in value following these announcements, highlighting the interconnectedness of global trade policies and digital asset valuations.
The tariffs have led to increased uncertainty among investors, prompting many to liquidate their positions in riskier assets like Ethereum. This reaction is indicative of a broader trend where geopolitical tensions and economic policies directly influence cryptocurrency prices. Analysts noted that such trade policies could lead to inflationary pressures and a stronger dollar, making cryptocurrencies less attractive to international buyers.
Future Outlook for Ethereum Under Trump's Administration
Looking ahead, Trump's administration is likely to focus on stricter regulations for cryptocurrencies. This could manifest in enhanced oversight that may slow down the adoption of Ethereum by businesses and individuals. However, there is also potential for increased legitimacy if clear regulations are established.
Moreover, Trump's interest in Central Bank Digital Currencies (CBDCs) might further complicate the landscape for Ethereum. As the U.S. explores its digital dollar initiative, Ethereum's decentralized finance (DeFi) ecosystem could face stiff competition from state-backed digital currencies.
Technical challenge
The main technical graph for Ethereum BITSTAMP:ETHUSD indicates on Bearish trend in development, since mid-December 2024, with acceleration occurred a day before Mr. Trump entered the White House.
Key support considered as 100-week SMA (near $2550 in this time) and $2200 flat multi bottom, that helps so far; otherwise (in case of breakthrough) we believe it could lead the Ethereum price much lower, as it described on the chart.
Conclusion
In summary, while Trump’s personal investment in Ethereum marks a notable shift from his previous criticisms, his administration's policies—especially regarding tariffs—have created a challenging environment for Ethereum investors. The combination of regulatory uncertainty and macroeconomic factors will likely continue to influence Ethereum's market performance in the near future.
