#ETH falling wedge?📊#ETH falling wedge?
🧠From a structural perspective, the yellow support zone was broken yesterday, so it turned into a resistance zone. Although there was a good touch response yesterday, it was a pity that the bullish power did not continue. The breaking of the bullish defense point means that a larger short structure has appeared. Therefore, we cannot be too optimistic before the reversal structure of the same cycle is built.
➡️From a graphical perspective, there is a chance to form a falling wedge here. If this scenario is established, we can observe the support performance near the large cycle rising trend line to decide whether to participate in long transactions.
Let's see 👀
🤜If you like my analysis, please like 💖 and share 💬 BITGET:ETHUSDT.P
ETHBULLUSDT trade ideas

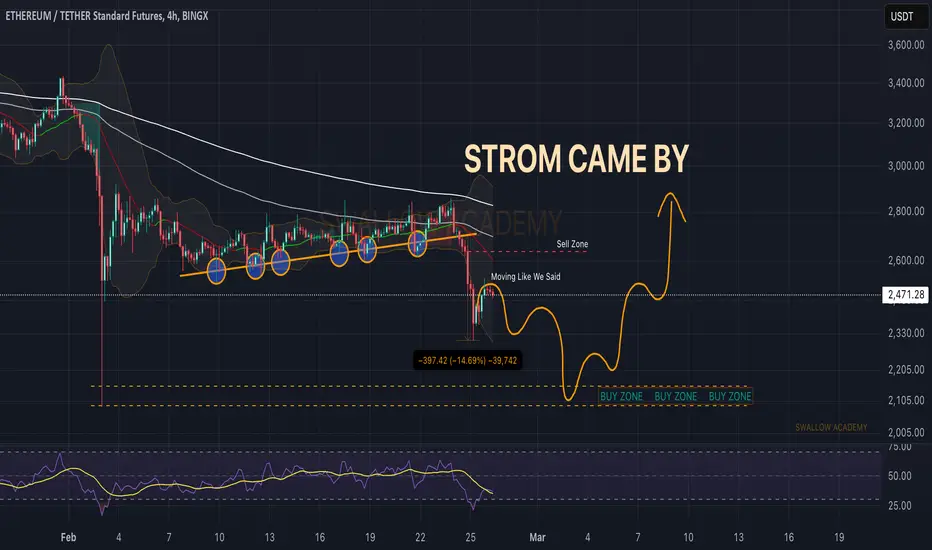
Ethereum (ETH): Needs a Proper SupportWhile we had a good downward movement and a rejection from 200EMA, the price is still hovering in between upper zones and lower zones, so the most logical thing here is to find a proper support from where to bounce, which would be our target area near $2000.
So far price has been moving exactly as we need, so a smaller correction is going on and will go before another fall!
Swallow Team

Market Price vs. True Value?Do you want to focus on the current market price of your investment, or its intrinsic value?
Every path comes with its own risks. Manage risk well, and you will reap well-deserved rewards.
Happy investing!

ETH - LONGEthereum has dropped more than 40%, it was hacked, people sold, and it's also a bit lower than before the election results. The Fear & Greed Index is at 10, something that hasn't happened since 2022. It's time to give it a chance. I think it's a good buying opportunity. There is support at 2000 and then around 1700. So it could keep falling, but I think it's a good time to start preparing anyway.

ETH Holding at $2200. Buy now?ETH holding here at 2200 which is key supports area.
i would starts accumulate more ETH Here for long term buy.
if it breaks down i will exit and re-analyse again
BUT its holding for now.

ETH update#ETH in longer time frames is making a nice pattern of an M harmonic pattern which is demanded by a zone from the start of the pattern i think this zone can make a big rise in this market but for now the market is bearish as we have a real negative pattern in BTC too

ETHUSDT, Is it time for the biggest Altcoin?Hi fellow traders, ETHUSDT will be ready to make a move higher from the blue box after it completes the flag correction in ABC formation. Target will be 3429.75. Good luck and trade safe!

ETHUSDT 1WAfter completing the Harmonic Bat pattern, the price encountered increased selling pressure. Over the past two years, it has never dropped below the 200-week moving average, which has acted as a strong support level. We need to see if it will hold again this time.
If the weekly candle close ends up below this moving average, it won’t be favorable for Ethereum. In that scenario, it might be wise to stay away from ETH for a while until a better technical setup emerges.

Ethereum has turned bearish (12H TF)After the CH turned bearish and lost the flip zone, along with the formation of a large liquidity pool below the chart, there are multiple confirmations that Ethereum is in a bearish structure.
It is expected to reach the lower demand zone and sweep the liquidity pool along its path.
A daily candle closing above the invalidation level will invalidate this analysis.
Do not enter the position without capital management and stop setting
Comment if you have any questions
thank you

ETHBitcoin (BTC) has shown significant volatility over recent months. It experienced a sideways trading pattern, which eventually led to a bearish breakout, with traders shifting their positions into shorts. This movement highlights the ongoing uncertainty in the market. Analysts suggest that investors should stay alert for potential shifts in momentum and keep an eye on key support and resistance levels. As always, thorough research and risk management are essential when navigating the unpredictable terrain of cryptocurrency markets.

ETHA sideways movement has formed on ETC
Bitcoin (BTC) has shown significant volatility over recent months. It experienced a sideways trading pattern, which eventually led to a bearish breakout, with traders shifting their positions into shorts. This movement highlights the ongoing uncertainty in the market. Analysts suggest that investors should stay alert for potential shifts in momentum and keep an eye on key support and resistance levels. As always, thorough research and risk management are essential when navigating the unpredictable terrain of cryptocurrency markets.

#ETH breaks downtrend line📊#ETH breaks downtrend line📈
🧠We broke downtrend line and formed a long structure, but we are currently in resistance zone, so we need to wait for price to return to downtrend line or yellow support zone before we can participate in new long trades.
➡️If we can form an ascending triangle in current resistance zone and break through, then I will consider participating in some small long trades at market price.
⚠️Note that downside risk is not completely eliminated, so new trades need to be conservative.
Let's see👀
🤜If you like my analysis, please like💖 and share💬
BITGET:ETHUSDT.P

ETHUSDT - Limited Return PriceEthereum is a reliable network for financial transfers and transactions and can be considered the second most popular digital currency after Bitcoin. Currently, this currency has reached the price range of $2,500 with temporary decreases, but this price is at its lowest level and the probability of liquidity entering this price area is very high. This price level can be used for long-term investment. I specify two targets for this price area: $4,000-5,000.
Sasha Charkhchian

Ethereum Faces Market Liquidation—Is There Hope for a Rebound?Ethereum is caught in the storm, plunging 9.50% in just 24 hours as liquidations grip the crypto market. With trading volume up 68.73% to $42.79 billion, it's clear that volatility has taken over. Over the past week, ETH has lost 8.08%, and in the last 30 days, it's down a staggering 27.67%.
With ETH now at a market cap of $291.3 billion, its dominance has slipped to 10.17%, reflecting the growing uncertainty.
Warning Signs from the Charts
🔹 Death Cross (EMA 50/200) – A strong bearish indicator that signals extended downside risk.
🔹 RSI Nearing Oversold – ETH is rapidly approaching critical buying zones, but will traders step in?
What’s Next for Ethereum?
📌 Bullish Case – If buyers return, ETH could push toward $2,870, reclaiming lost ground.
📌 Bearish Case – If market fear lingers, Ethereum could tumble toward $2,175, its next major support level.
Ethereum’s short-term fate hinges on whether bulls can counteract selling pressure. While uncertainty remains high, a rebound could be brewing if buyers step in at key support levels.
So, does hope spring eternal for ETH, or is more downside ahead?

Ethereum (ETH): Smaller Correction + Further DipEthereum has been moving just as we need—a proper breakdown + smaller correction—and now ready for another round, it seems.
We are looking for a price to reach our lower target zone of $2000, which would be our buy zone as well so keep an eye on it!
Swallow Team
ETH/USDTOn the chart, we observe that the ETH/USDT pair is moving within a descending channel and is trading below the 20, 50, 100, and 200-day moving averages. This view confirms that the overall trend is weak.
The areas highlighted in red are Order Block (OB) zones where heavy institutional buy/sell orders were executed in the past. In particular, the $2160 level on the demand side has previously acted as critical support where the price received a strong reaction. If the price holds in this zone, a short-term rally toward the upper band of the descending channel could be seen. However, if the OB zone breaks to the downside, the decline might deepen and new lows could be tested.
The RSI indicator is currently neutral, so it does not signal overbought or oversold conditions.
Since the MACD continues to remain in negative territory, there is not yet a strong bullish momentum signal.
Additionally, due to the lack of a significant increase in volume, additional catalysts are needed to expect a sharp change in market direction in the short term.
In summary, if the OB zone is maintained, the likelihood of an upward correction increases. Otherwise, selling pressure may intensify, and if a daily candlestick closes below the demand support line, the $2160 level should be used as a stop-loss. It is important to use stop-loss and similar risk management methods in both bullish and bearish scenarios.

Is Ethereum Ready to Bounce from the Channel Low?
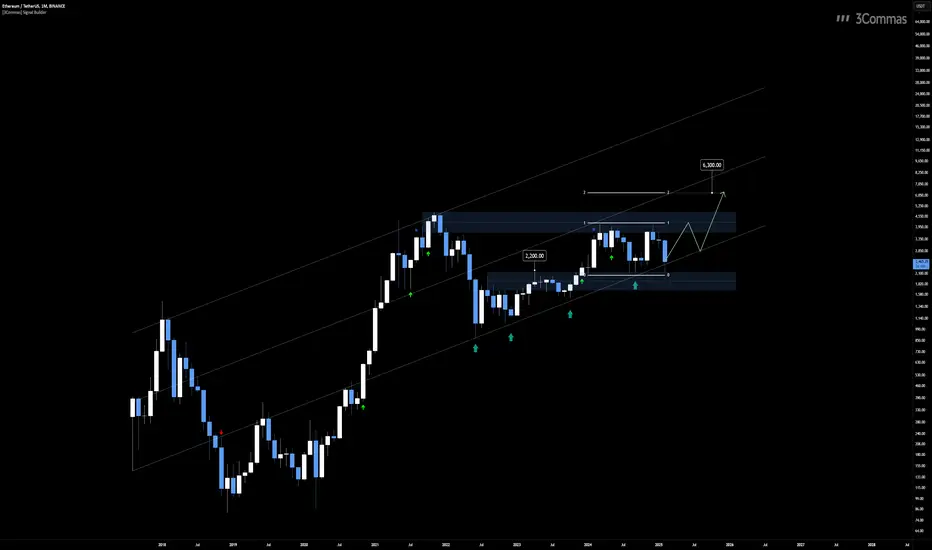
The BINANCE:ETHUSDT BITSTAMP:ETHUSD chart shows Ethereum trading near the lower boundary of the ascending parallel channel, with the $2,200 level serving as a key support zone. This area is particularly significant as it aligns with previous resistance turned support, making it an attractive entry point for long-term buyers.
Historically, ETH has respected this lower channel trendline, bouncing off it on multiple occasions. The current price action suggests that the pattern remains intact, reinforcing the possibility of another upward move from this region.
If the price holds and momentum builds, projecting the width of the current consolidation channel gives an estimated upside target near the $6,300 level. This aligns with the channel’s upper boundary and represents a potential long-term target should the bullish scenario unfold.
👨🏻💻💭 What’s your plan? Will ETH hold $2,200 and climb toward $6,300, or is more consolidation ahead? Share your thoughts and let’s discuss potential strategies!
__
The information and publications within the 3Commas TradingView account are not meant to be and do not constitute financial, investment, trading, or other types of advice or recommendations supplied or endorsed by 3Commas and any of the parties acting on behalf of 3Commas, including its employees, contractors, ambassadors, etc.
The bearish scenario for Ethereum is now active (1D)We have always relied on the flip zone from our previous Ethereum analyses. Now that this zone has been broken, the bearish scenario for Ethereum is active.
A more accurate interpretation suggests that this is the correct structure. Given this, we have been in Ethereum's bearish Wave C for some time.
Ethereum is expected to move from the red zone toward the green zone soon.
For risk management, please don't forget stop loss and capital management
Comment if you have any questions
Thank You

ETH and bybit's Hack impactDespite Bybit’s hack that resulted in $1.4B of ETH being stolen, its strong marketing and support from other exchanges suggest that additional selling pressure may be limited. However, Vitalik’s hints at a possible rollback could pose significant risks to the Ethereum network. I'm still bullish on ETH for next week, and the position you see here is my trading idea. Good luck!

ETHUSDT 1WETH ~ 1W Analysis
#ETH We hope this support will continue to be maintained. To continue to maintain the dominance of the bull.

ETH Analysis (SMC)After yesterday's breakdown, I think price can recover itself and fill imbalance gap that create. Also fibo can be good resistance zone for price, if price through fibo zone, waiting for CHoCH.

The key is whether it can rise above 2674.15
Hello, traders.
If you "Follow", you can always get new information quickly.
Please also click "Boost".
Have a nice day today.
-------------------------------------
(ETHUSDT 1M chart)
The key is whether it can receive support near the important support and resistance area of 2513.01-2706.15 and rise above the M-Signal indicator on the 1M chart.
If it fails to rise, you need to stop trading and check the situation.
The reason is that there is a high possibility of further decline.
-
(1W chart)
In order to turn into an uptrend, it is expected that the price will have to rise above 2706.15 at least to maintain it.
The reason is that the M-Signal indicators on the 1W and 1M charts are likely to cross near that point.
If it falls below 2316.10, it is likely to fall until it meets the HA-Low indicator.
Since the HA-Low indicator is likely to be newly created as the price falls, it is important to see if there is support near it if it is newly created.
The HA-Low indicator is currently formed at 1340.12.
-
(1D chart)
The key is whether it can find support near 2316.10-2513.01 and rise above 2674.15.
If it fails to rise, it is likely to show a step-down trend.
Since it has currently fallen below the M-Signal indicator of the 1M chart, it can be seen as a downward trend from a long-term perspective.
However, since the transaction with the M-Signal indicator of the 1M chart is not far away, it is thought that it is likely to rise.
Therefore, the HA-Low indicator point of 2674.15 is likely to be the high point of the rebound.
-
Basically, the time when we can trade is when the price rises above the M-Signal indicator of the 1D chart and maintains the price.
And, when the M-Signal indicators of the 1W and 1M charts are aligned.
Otherwise, the transaction must be short and quick.
When the downtrend begins during spot trading, it becomes busy.
The reason is that we need to increase the holding quantity.
There are two ways to increase the number of holdings: investing a lot of money to buy, and increasing the number of coins (tokens) corresponding to the profit.
If you have a lot of cash or about 20% of the total investment, you can use the method of buying when the M-Signal indicator on the 1D chart rises above the level and making a profit.
-
If you have little or no cash, you will eventually have to sell the coins (tokens) you currently have and buy them again to increase the number of holdings.
In other words, when there is a rebound, you should sell part of the purchase principal, and when there is a decline, you should buy back the amount you sold.
The ultimate goal of this method is to recover all of the purchase principal and hold the remaining number of coins (tokens).
I think there is no better way for long-term investment.
-
Thank you for reading to the end.
I hope you have a successful transaction.
--------------------------------------------------
- Big picture
I used TradingView's INDEX chart to check the entire range of BTC.
(BTCUSD 12M chart)
Looking at the big picture, it seems to have been maintaining an upward trend following a pattern since 2015.
In other words, it is a pattern that maintains a 3-year upward trend and faces a 1-year downward trend.
Accordingly, the upward trend is expected to continue until 2025.
-
(LOG chart)
Looking at the LOG chart, you can see that the upward trend is decreasing.
Accordingly, the 46K-48K range is expected to be a very important support and resistance range from a long-term perspective.
Therefore, I expect that we will not see prices below 44K-48K in the future.
-
The Fibonacci ratio on the left is the Fibonacci ratio of the uptrend that started in 2015.
That is, the Fibonacci ratio of the first wave of the uptrend.
The Fibonacci ratio on the right is the Fibonacci ratio of the uptrend that started in 2019.
Therefore, this Fibonacci ratio is expected to be used until 2026.
-
No matter what anyone says, the chart has already been created and is already moving.
It is up to you how to view and respond to it.
Since there is no support or resistance point when the ATH is updated, the Fibonacci ratio can be appropriately utilized.
However, although the Fibonacci ratio is useful for chart analysis, it is ambiguous to use it as a support and resistance role.
The reason is that the user must directly select the important selection points required to create the Fibonacci.
Therefore, it can be useful for chart analysis because it is expressed differently depending on how the user specifies the selection point, but it can be seen as ambiguous for use in trading strategies.
1st: 44234.54
2nd: 61383.23
3rd: 89126.41
101875.70-106275.10 (when overshooting)
4th: 134018.28
151166.97-157451.83 (when overshooting)
5th: 178910.15
-----------------

Bull Market Started. GO UP ETHThe 2300 region that I have been waiting for a long time has finally come again. While BTC is falling, ETH is now looking stronger. A nice bottom structure has formed in ETHBTC. I think the bull market has started and the rise is coming from here. I am adding to my ETH contracts by the end of April.
