This plan gave me 80 pips of profit in Ethereum
Late yesterday, I came up with a perfect trading plan based on the accurate analysis of Ethereum trends. The expected support level is 2686 target, and the rebound rose to the target level of 2780. This plan successfully allowed me to gain 80 pips of profit in Ethereum trading. I think some great traders saw my trading plan at the time, and now they must be very happy and excited to have reaped the same high profits as me. Of course, this also makes me feel very proud and satisfied because my selfless efforts have helped more traders.
Next, I will continue to share my accurate trading plans for gold, Bitcoin, Ethereum, crude oil investment, etc., so that I can help more traders and stop them from being confused by investment failures! ! !
BINANCE:ETHUSDT
Mr. Baker
ETHBULLUSDT trade ideas

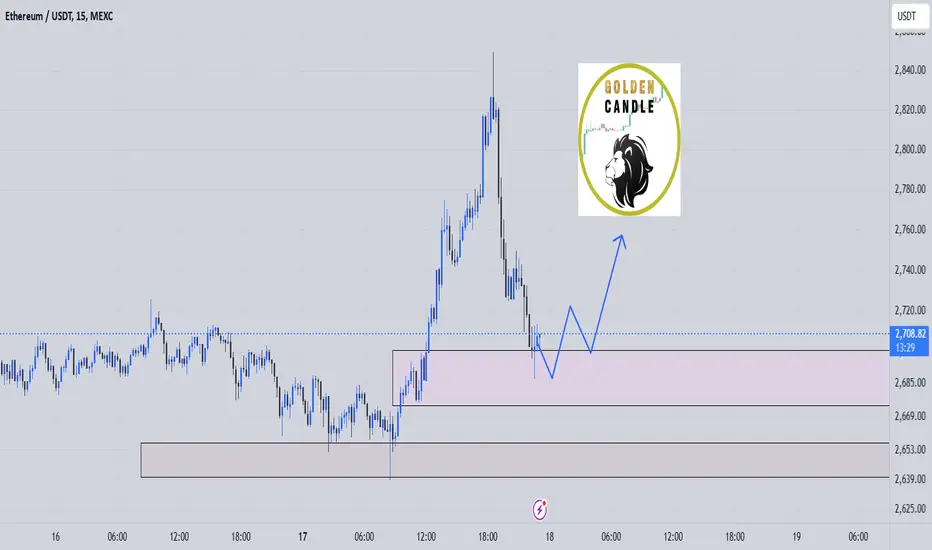
ETH - Long trade Simple set up
Trade the channel. I have entered long at the bottom of the channel with the exit plan being the top of the range.

Lingrid | ETHUSDT bullish REVERSAL Potential from Key ZONEBINANCE:ETHUSDT market continues to consolidate following the spike at the beginning of this month. Price is moving sideways above the key zone around 2500. Looking left at previous price action, we can see that this zone has served as a bounce point before, triggering bullish momentum. On the monthly timeframe, price has swept the liquidity below September, October, and November lows, effectively testing last year's low area. After such a significant move, I expect that price could close above the January high on the February monthly candle close and continue to move higher. My goal is resistance zone around 3300
Traders, if you liked this idea or if you have your own opinion about it, write in the comments. I will be glad 👩💻

Technical Analysis of ETHUSDT (4H Chart - OKX)Technical Analysis of ETHUSDT (4H Chart - OKX)
Trend Analysis & Market Outlook
The chart indicates a strong downtrend, with price recently attempting a recovery from the lower support zone.
The 200 EMA (3,169.88 USDT) serves as a major resistance level.
Bearish Supply Zones are present at 3,408.28 USDT and above, limiting potential upside.
The 50 EMA is currently acting as support, which might indicate a short-term bullish trend.
Key Levels & Trading Strategy
Support Levels:
2,696.83 USDT
2,691.13 USDT
2,587.32 USDT (strong demand zone)
Resistance Levels:
2,739.64 USDT (short-term resistance)
2,938.10 USDT (mid-term target)
3,169.88 USDT (major breakout level)
Market Sentiment:
Bearish Bias Below 3,169.88 USDT
Bullish Confirmation Above 2,739.64 USDT with possible continuation to 2,938.10 USDT
Risk Management & Trade Setup
Bullish Scenario: If price holds above 2,700 USDT, it could test resistance at 2,739 - 2,938 USDT.
Bearish Scenario: A rejection at 2,739 USDT may lead to another drop toward 2,587 USDT.
Stop Loss (SL): Should be placed below 2,587 USDT to limit downside risk.
Final Conclusion
Short-term Outlook: Cautiously Bullish (as long as price stays above 2,700 USDT)
Long-term Trend: Bearish (unless price reclaims 3,169 USDT)
Best Strategy: Monitor price action at 2,739 USDT; breakout = bullish continuation, rejection = short opportunity.
Would you like an in-depth risk-reward analysis for a potential trade? 🚀

ETH update#ETH can rise to the supply zone which is located higher than the confirm line if market crosses the line it can rise to thi , the next moves will be updated

eth long midterm"🌟 Welcome to Golden Candle! 🌟
We're a team of 📈 passionate traders 📉 who love sharing our 🔍 technical analysis insights 🔎 with the TradingView community. 🌎
Our goal is to provide 💡 valuable perspectives 💡 on market trends and patterns, but 🚫 please note that our analyses are not intended as buy or sell recommendations. 🚫
Instead, they reflect our own 💭 personal attitudes and thoughts. 💭
Follow along and 📚 learn 📚 from our analyses! 📊💡"
#ETH is holding strong, What does it mean?Ethereum (ETH/USDT) on the weekly timeframe is consolidating within a large symmetrical triangle, nearing a crucial decision point. Price is currently testing the 100 EMA (blue) as support, while the 200 EMA (purple) remains below as a stronger long-term support level. Holding above the 100 EMA and ascending trendline could trigger a breakout towards the $3,800 - $4,200 resistance zone. A clean break above this range would confirm bullish momentum.
However, if ETH loses the 100 EMA and breaks below the ascending trendline, the next major support lies around the 200 EMA near $2,300. This is a less likely scenario.
Volume remains low and must increase in the coming weeks , indicating an imminent breakout. Confirmation above $3,200 or below $2,400 will dictate the next major trend.
Alts will follow ETH and we will see a major breakout in altcoins throughout the market.
What do you think?
Let me know in the comment section and please hit that like button.
Thank you
#PEACE

11 very reliable rules for short-term trading
1. Avoid revenge trading
When a trade is closed, whether it is a profit or a loss, you need to stick to the rules unswervingly. After executing a stop loss, try not to look at it again within 24 hours. This can effectively avoid revenge trading. Opening orders with revenge emotions is likely to increase losses. Some people believe that you should stand up from where you fell, but it is more important to wait and see calmly before triggering new entry conditions. Since traders have to look at charts for several hours a day, it is difficult to resist the temptation to open another order to save the situation after the stop loss. When using leverage to make swings, it is especially necessary to avoid a revenge mentality
2. Try not to participate in trading on weekends
Every weekend, the volatility of cryptocurrency prices will increase, and the trading volume will be small. This makes it difficult to predict short-term price trends. The reason is simple. Weekend buy and sell orders are usually smaller, market liquidity is lower, and whales are more likely to manipulate short-term prices, which makes the disadvantages of retail traders more obvious. In addition, since the cryptocurrency market is open 24/7, the trading intensity is much higher than that of the stock market, and weekends are a good time to decompress and rest, after all, life is more important than trading.
3. Keep trading at specific times
As mentioned earlier, the cryptocurrency market is open 24/7, and it never stops. Even full-time traders cannot keep an eye on the market. In order to keep a clear mind, you can set a fixed trading time for yourself. After opening an order during the trading hours, set the stop profit and stop loss, and then you can do other things. This eliminates the urge to constantly check your phone or study the K-line, and trading will not affect your normal life.
4. Don't have feelings for an asset
If you fall in love with the asset you are trading, it is easy to make mistakes in your decision. Excellent traders use efficiency and rules to make money and give themselves an advantage, because most people's trading behavior in the market is dominated by emotions. "Being an emotionless trading machine" can ensure decisiveness and principle in trading. One of the important reasons why many traders suffer heavy losses is that they are easily emotionally attached to certain specific altcoins, teams or projects. This is acceptable for medium and long-term investors, but it is a potential disaster for short-term traders.
5. Keep simple trading rules
Traders often combine multiple indicators, news and candlestick patterns to try to find a suitable confluence point for trading. This is not a problem in itself, but be careful to avoid over-analysis, which complicates the problem. In fact, when the candlestick pattern that suits your own system appears on the chart, you can start trading. At the same time, it is particularly important to pay attention to stop loss setting and position control.
6. Only trade in the right state of mind
When you are angry, tired or stressed about something, don't trade, and your state of mind will affect your judgment. The key to maintaining a good state of mind is to have other daily activities outside of trading. For example, fitness, reading, and spending time with family and friends can all help cultivate the right trading philosophy.
7. Record a trading diary
Trading diary review is boring, but it is actually meaningful because it can help you avoid making the same mistakes. There are specific reasons behind profitable and losing orders. Recording trading details is a way to learn and grow quickly.
8. Don't try to catch a falling knife with bare hands
"Catching a falling knife with bare hands" refers to traders trying to buy the bottom of an asset that is plummeting. The motivation for bottom fishing is usually to lower the cost price and make up for the losses caused by the sharp decline. The idea of trying to accurately buy the bottom during the plunge is unwise. Waiting for a stabilization rebound and the resistance level to turn into a support level before entering the market is a more prudent approach.
9. Don't ignore extreme market conditions
While referring to technical analysis indicators, black swan events or other extreme market conditions cannot be ignored. Ultimately, the market is driven by supply and demand, and sometimes the market is extremely unbalanced.
Take the RSI relative strength index as an example. Generally, if this indicator is below 30, the asset can be considered oversold. Does this mean that it is safe to buy the bottom? Not really! It only shows that the market is under the control of sellers. Under special market conditions, the RSI may reach extreme values, and may even drop to single digits or close to zero. Even so, it does not necessarily mean that the price is about to reverse. Trading based entirely on technical indicators can lead to the loss of a lot of money. This is especially true in black swan events, because extreme price behavior can cause technical indicators to fail. The market can continue to move in one direction, and no analytical tool can stop this trend.
10. Don't forget that technical analysis is a game of probability
There is no absolute correctness in technical analysis, it is essentially just a game of probability. That is to say, no matter what technical method you use to formulate a strategy, there is no guarantee that the market will operate as expected. Technical analysis is just a prediction and cannot be operated as a deterministic event. No matter how rich your experience is and how dazzling your record is, you can't take it for granted that the market will follow your technical analysis. If you hold this kind of thinking, it is easy to over-bet on a certain preset, resulting in excessive risk exposure, and the market will teach you a lesson every minute.
11. Don't over-trade
The number of transactions is not positively correlated with profit. Even if the market provides multiple opportunities, try not to operate more than 3 transactions at the same time. The more types and numbers of positions, the more difficult it is to manage risks. If multiple transactions are stopped out, you may suffer significant losses. Jesse Livermore, the pioneer of day trading, said something very reasonable, "Money is earned by patient waiting, not by trading." We should try to avoid trading for trading. In fact, under certain market conditions, staying on the sidelines and waiting for opportunities to enter the market can help us avoid a lot of unnecessary risks.
What is least lacking in trading is opportunities, and the most precious thing is the principal. Every trader should formulate and improve a set of trading rules that suits him or her. After summarizing the lessons of failure and success, he or she can make more wise decisions and improve the winning rate of transactions.
Mr. Baker

Most Important EthUSDT Chart you need to see.Hello Dear,
The Gann chart, attributed to the legendary trader W.D. Gann, is a powerful tool for predicting price levels and time cycles. While it may seem complex initially, mastering its principles can give traders a significant edge. This article will break down the basics of the Gann chart and provide you with actionable tricks to incorporate it into your trading strategy.
What is a Gann Chart?
A Gann chart combines price and time to identify key levels of support, resistance, and potential trend changes. Gann's theory is based on the concept that price and time move harmoniously. By plotting geometric angles and price levels on the chart, traders can identify critical points where the market is likely to react.
The chart shown here overlays key angles and levels, such as:
0° (Base Level): Starting point for calculations.
90°, 180°, 270°, and 360°: Significant price levels derived from Gann’s geometric principles.
These levels serve as both support and resistance zones, depending on the market trend.
📊 Interpreting the Chart
1️⃣ Key Levels to Watch
🔹 Support Zones:
$2,596 – First strong support level.
$2,346 – If the price drops further, expect buyers here.
$2,117 – A major demand zone. If ETH reaches this level, expect a strong reaction.
🔹 Resistance Zones:
$2,858 – Current price level; breaking above could push ETH higher.
$3,128 – Next key resistance level; breaking this confirms a bullish trend.
$3,415 - $3,713 – Strong resistance area; ETH needs momentum to break through.
$4,024 - $4,345 – If the rally continues, these are the next upside targets.
⏳ Time Cycles & Trend Shifts
The chart also shows Gann time cycles (vertical lines), which help predict possible trend shifts. Based on the setup:
🔸 ETH has recently bounced from a key support level, suggesting a possible trend reversal.
🔸 If ETH maintains momentum, we could see a push toward $3,128 soon.
🔸 However, if it fails to hold above $2,596, it might revisit lower support zones.
📈 How to Trade This Setup?
✅ Bullish Scenario:
If ETH breaks above $2,858, look for a move toward $3,128 - $3,415.
A breakout above $3,713 could trigger a strong rally toward $4,024+.
❌ Bearish Scenario:
If ETH fails to hold $2,596, expect a drop toward $2,346 or even $2,117.
Losing $2,117 could open the door for deeper correction.
🔎 Final Thoughts
Ethereum is at a crucial decision point. If bulls can break above $2,858, we might see an exciting rally. But if ETH struggles, lower support levels could come into play.
What do you think? Bullish or Bearish? Let’s discuss! 🔥👇

ETH triple top still in play. 300% after short targets are met.Back in december i created an idea pointing out at double top on ETH. SInce then triple top has formed and still in play. Even if we see some rise in price in the short-term expect more down side in coming weeks
December post:
Main target is around 1500$ and this will be great entry point to get 300%

Ethereum (ETH): Waiting For $2,700 To Be BrokenWe are seeing a possible breakout to happen on the daily timeframe where buyers are showing pressure near current zones.
We expect to see a breakout from the $2700 zone, which then would send the price for an upward movement towards $3100.
Swallow Team

ETHUSDT: Buy ideaOn ETHUSDT we have an upward trend and this is explained by three (03) factors:
1- We a red candle with a small body and a long low wick;
2- Breaking of the vwap indicator;
3- Break of the resistance line.

Ethereum (ETH): Seems A Good Buying OpportunityEthereum is sitting on a strong bullish trend here where the last weekly candle has stopped.
Combined with EMAs, this zone makes a good, strong buying zone from where we are expecting to see a proper upward movement as long as we keep the price above this zone here.
Swallow Team

Short trade
4HR TF Overview
Sellside Trade
Date: Thursday, 13th February 2025
Time: 3:00 AM (NY Time)
Trade Details:
Entry: 2662.45
Profit Level: 2586.43 (+2.86%)
Stop Level: 2689.10 (-1.00%)
Risk-Reward Ratio (RR): 2.85
Reason: Observing price action since the Mon 10th of February I assumed we had reached a pivotal supply level indicative of a sellside trade.

ETHUSD about to drop for more than 500 dollars!!Based on my trading algorithms ETHUSD will drop for 500 dollars!

ETH Maybe the current cycle of ETH be like this or it is in 4th impulsive wave of the cycle. (I am not expert at Elliott waves)

Ethereum Update
Ethereum is still moving sideways or ranging since Feb 03 and the latest DWHL as of current is 2,921 HIGH & 2386 LOW until now price is not breaking out both Support & Resistance. 📈📉
By identifying the inside range, Take note this is note base on EW this is just a normal wave count for normal structural movement.
First phase already made a 5 counts next the yellow phase and next we are attempting next the cyan phase which possibly move to test the PBr1 support at 2.4k approx price, If we manage to break or test the 2.6k support at x Mark high probability we can proceed to B then next rejection move until PBr1 retest 🧘
Patiently waiting for this movement to happen, No rush 💯

ethereum 1d Ethereum daily chart descending wedge formation should be expected to start moving upwards

ETH Update I still expect Ethereum to reach $2900 . Currently, we are in a range-bound situation, and as long as we don't break below this area, this scenario remains viable , check out 🫡

Grasp the support and pressure points to accurately obtain profiHello traders, today I will share a set of accurate trading rules to help you avoid detours on your investment journey. There will be many professional terms that you cannot understand, or even misunderstand, which will lead to missed or wrong market conditions. Today I will sort out the popular ones for you brothers.
Normal market conditions are composed of support and pressure levels. When they reach the pressure level, they will fall back, and when they reach the support level, they will rebound, which is why we see the distorted trend chart today.
What is the pressure level?
When a wave of market conditions rises to a certain position, there will be a lot of selling orders above, which will cause the market to fail to rise. This is called the pressure level for short. The pressure level is also like the first pressure level, the second pressure level, and the third pressure level. Breaking through the first pressure level indicates strength, and the market will continue to rise. If it hits the second and third pressure levels, the higher it hits, the weaker the strength will be, just like people always need to rest when running. The market will also fall back. These pressure levels are also the positions where we sell long orders or buy short orders, so brothers can combine the pressure levels given by the market conditions I issued to sell your long orders or short orders. Don’t you know where to short? If you don't know where to sell long orders, just look at the pressure I analyze every day.
For example: Bitcoin will rebound in four hours if it stands at 68,800 today. The pressure above the rebound is: 69,500 and 69,900. These two positions are our selling points for long orders and buying points for short orders. If we break through these two prices, we can do it manually and continue to wait at the next pressure level. Remember not to hold on. If it breaks through, it means that the long side is very strong and it is useless to hold more.
What is the support level?
When a market falls to a certain position, there will be a lot of buying orders, which prevents the market from falling further and forms a support point, which is called support level for short. The support level is like a level. There are the first support level, the second support level, and the third support level. There will be a rebound at each support level. If it falls directly through, it means it is strong and the market will continue to fall, hitting the second and third support levels. The more it falls, the weaker the strength will be. At this time, we can try to bet on a rebound long order at the support level. These support levels are also the positions where we sell short orders or buy long orders. So brothers can combine the support levels given by the market I issued to place your short orders or go long. Don’t you know where to go long? If you don't know where to sell short orders, just look at the support I give in my daily analysis. For example: Ethereum cannot stand firm at 2465. It will continue to fall and test the support below: 2410.2383. These two positions are also our short selling points and long buying points. If it falls below, we will manually leave and wait at the next support level. Contracts are originally about risking a lot with a small investment, and the probability of success through trial and error with a small cost. There is no absolute success. As long as we make a mistake, we will leave the market. Don't hold on to it! ! !
To sum up: If there is no big news when placing orders during the day, you can wait for the first support level to make a long order, or the first resistance level to make a short order. As long as it falls back a little, you can basically make a profit. If it is relatively stable, you can wait for the second or third support level to make a long order, or a short order.
After saying this, do you understand a lot, brothers? Good traders are shorting at resistance levels and long at support levels? I will update here every morning and evening. If you listen, we will not be leeks.
Position management
Don't bet all positions directly. You understand the reason, but you are too impulsive and always want to get your money back quickly. Human nature is difficult to control. I can only say that no matter how many times you leverage, as long as you control your position within 5%, you have a chance to turn over. If you don't control it well, you won't even have a chance to turn over. What's the point of making money today and losing tomorrow? All are gamblers.....
Brothers, if you have any questions, please leave me a message below, I will tell you everything I know without reservation, the market is huge, let's play together, we want to make money from the market, not be the payer of the market, if you like it, please like 👍 and follow me
BINANCE:ETHUSDT BINANCE:BTCUSDT.P

ETHUSDT.1DTechnical Indicators & Market Sentiment:
🔹 Trendline Analysis:
ETH previously broke below a descending trendline but rebounded near the $2,200 zone.
It is now attempting to break above the R1 trendline, which will determine the next trend direction.
🔹 Potential Breakout Scenario:
A successful breakout above R1 will likely push ETH toward $3,500, followed by a retest of $4,000-$4,100.
The next major target in a bullish breakout would be $4,500-$5,000 based on previous highs and Fibonacci projections.
🔹 Potential Breakdown Scenario:
If ETH fails to break R1 and faces rejection, a drop toward $2,208 (S1) is likely.
A breakdown of $2,200 could trigger a deeper correction toward $1,800-$1,900, with an extreme bearish target at $1,521.
🔹 Liquidity & Volume:
The buying volume needs to increase for ETH to break the R1 resistance effectively.
A lack of volume may cause fake breakouts before the next major move.
🔹 Market Psychology:
Ethereum remains in a recovery phase following its last correction, with traders waiting for confirmation before committing to new positions.
The $3,500-$4,000 range is a psychological barrier; a clean break will likely trigger FOMO buying.
Conclusion & Trading Strategy:
Given the current market conditions, I am preparing for two key scenarios:
1️⃣ Bullish Breakout (Trend Reversal Confirmation):
A daily close above $2,800-$3,000 with strong volume confirms bullish continuation.
If ETH sustains above this level, I will enter a long position, targeting $3,500, $4,000, and ultimately $4,500-$5,000.
2️⃣ Bearish Rejection & Retest of Support:
If ETH fails to hold above $2,700 and faces rejection at R1, a retracement to $2,200 (S1) becomes likely.
A break below $2,200 may open a shorting opportunity with a target around $1,800-$1,900.
Risk Management:
Stop-loss for longs: Below $2,600 to avoid bull traps.
Stop-loss for shorts: Above $3,000 in case of a breakout.
Leverage: Low to moderate, considering high volatility.
The next few weeks are critical for Ethereum’s trend direction. If it successfully flips R1 into support, a strong rally may follow. Otherwise, a rejection could lead to another bearish wave, providing buying opportunities at lower levels.
Final Thought:
Ethereum is currently in decision mode, with a break above $2,800-$3,000 needed to confirm bullish strength. I will closely monitor price action and volume dynamics before entering any high-conviction trades.

ETHEREUM DOES 3X EACH SEASON ETHEREUM DOES 3X OF PREVIOUS ATH, EACH SEASON
From the previous data:. Last two bullish volatile seasons were on three x of previous season. If that trend continues, NASDAQ:TH might record FWB:12K ATH .
I CLEARLY MARKED ENTRY POINTS ( EP ), i.e DCA points. And TAKE PROFIT ( TP )/EXIT POINT WAS CLEARLY MARKED TOO.
I intentionally didn't include Stop LOSS because this is a long term HODL, The Risk Management here is entering with the margin you can afford to loss or forget for a long time ( position sizing )
ANALYSIS DONE BY CRU_COINS
Saturday 15th February 2025

ethereum ascending megaphone patternCRYPTOCAP:ETH ascending megaphone pattern will trigger upward momentum from the lower zone. 📈
