ETH LongStrong level to long, else you can see on the chart 1D inefficiency tested, fvg from Monday 13 jan holding well, built an order block recently at the same level that holds well
The force did not cause lower breakout, tested well 1h inefficiency from where I grabbed the position, picture looks very familiar to what we have seen in the past on ETH
Typical AMD model logic aiming for breakout higher, probably closing earlier though
ETHBULLUSDT trade ideas

ETH/USDT 1H: Bulls Charge Toward $3420 After Breaking Key LevelsETH/USDT 1H Chart Analysis
🚀 Follow me on TradingView if you respect our charts 📈Daily charts!
Current Market Structure:
Bullish trend confirmed after breaking previous high at $3280.
RSI: Hidden Bullish Divergence at 58.80, aligning with price momentum.
Volume Confirmation: Strong buying pressure supports the breakout.
Smart Money Levels:
Support: $3180 (Previous Consolidation High - PCH).
Resistance: $3340 (Premium Zone).
Key Level: $3246 (acting as equilibrium).
Trade Setup (Confidence 8/10):
Entry Zone: $3246 - $3250.
Targets:
T1: $3340
T2: $3380
T3: $3420
Stop Loss: Below $3175 (under PCH).
Risk Score: 7/10 (favorable Risk/Reward).
Market Maker Intent:
Accumulation phase completed at lower levels.
Currently in markup phase, targeting premium zones.
Volume Profile: Indicates strong institutional demand, supporting continuation.
Recommendation:
Long positions favored in the $3246 - $3250 range.
Watch for volume confirmation above $3280 for added confidence.
Maintain tight stops below $3175 to minimize downside risk.
Confidence Level: 8/10 for bullish continuation.
🚀 Follow me on TradingView if you respect our charts 📈Daily charts!

ETH is loading up for another runFor those who remember I had posted a weekly chart many months ago with the following pattern:
my idea was that the first stop would have been last ATH, level where price could have ranged for a while. Despite all the recent criticisms toward ETH I think we're still on track to that target. Yes, ETH is underperforming and there are plenty of better and cheaper solutions out there (example: Solana fees are super cheap compared to ETH) but all this doesn't matter because eventually it'll pump anyway.
As you can see on daily price formed an asymetrical triangle (continuation pattern) and RSI and OBV present bullish DIVs. Squeeze momentum instead presents a bigger bullish DIV. If I'm right the breakout should take the price to the daily R and from there to ATH.
I think it's a good moment to buy ETH, even ebcause if you check ETHBTC you can see it has kinda bottomed and I don't see it deviating much more from that trendline (max -16%) while it has a great upside potential upward:
If BTC top will be from 150 or 170 then that resistance would mean ETH should range between 12.3K to 15K USDT.
Good luck!
P.S.
From a more FA point of view I consider Ethereum's gas fees problem a huge one. Vitalik has had years to fix it and he did literally anything but this giving the green light to the competition. This is the reason why I do not trade on Ethereum blockchain and the reason why I bought SOL and SUI rather than ETH). If Vitalik doesn't harry up it'll be too late for ETH to catch up (not that I care).

Long trade
15min TF overview
Buyside trade
NY Session PM
Mon 27th Jan 25
12.30 pm
Entry 3080.00
Profit level 3295.08 (6.89%)
Stop level 3039.97 (1.30%)
RR 5.37
Reason: Buyside trade idea.? based on the narrative of supply and demand Day TF for directional bias and 15 min for price action entry.

ETH - Picture Perfect Prediction Our prediction from yesterday pre-FOMC has played out perfectly so far. That idea can be found here:
We did not know whether we would breakout or breakdown, but we gave a clear idea of what to watch for for the direction of the next move.
As Powell was taking questions, ETH broke to the upside. Then once that concluded and the initial move sold off, ETH came down and retested our triangle of old resistance as new support. Now we are seeing the move off that triangle which is getting close to our measured move price target around $3,350.
This target is also right in line with our solid white upper line (Falling wedge resistance). Would not be surprised to see some sell pressure come in at the top of our macro pattern but as soon as that falling wedge is broken ETH will start its rally to EUROTLX:4K +

ETH Elliott Wave AnalysisHello friends
We are witnessing the formation of a bullish pattern on the Ethereum chart and we expect the Ethereum price to grow.
Now if we look at the chart, we see that the formed microwaves indicate an upward trend and this trend can be formed in the form of 5 impulse waves or ABC zigzags.
But we are in wave 3 or C and we expect the price to grow until its microwaves are completed.
But the appropriate range for entry is the $2770-2780 range, because in addition to a strong support, the price cannot close in the closing range of wave 1.
Therefore, the best entry price is this range but it can also grow from this price. This depends on your capital management and risk tolerance.
This is a weekly analysis and it will take 8 to 12 weeks to achieve it.
The first target price is $4,850.
Be successful and profitable.

Ethereum is getting ready for a breakoutAfter a correction that lasted almost 1.5 months, Ethereum has formed a bullish divergence on the RSI at a strong support level, represented by an order block at $3K.
A "Falling Wedge" breakout is expected soon, and hopefully, this time, it will finally manage to break through the critical EUROTLX:4K level—only then will the altseason truly begin.

$ETH - Is Gearing Up for a MoveCRYPTOCAP:ETH | 4H
We have filled the 50% of its wick at 3k
Glad that we're seeing now an accumulation pattern (first LPS, we've successfully retested the demand)
3.5k is still acting as the local resistance level. However, if we manage to maintain the support at 3k, I'm inclined to believe there's potential for an upward trend.
Could be the start of a run?

eth sell midterm"🌟 Welcome to Golden Candle! 🌟
We're a team of 📈 passionate traders 📉 who love sharing our 🔍 technical analysis insights 🔎 with the TradingView community. 🌎
Our goal is to provide 💡 valuable perspectives 💡 on market trends and patterns, but 🚫 please note that our analyses are not intended as buy or sell recommendations. 🚫
Instead, they reflect our own 💭 personal attitudes and thoughts. 💭
Follow along and 📚 learn 📚 from our analyses! 📊💡"

ETH LIQUIDITY HEAT MAP ANALYSIS !here we have the chart for liq heat map of #ETH
in this chart there is a BOLD liq zone which the market went down to take it !
usually the price go to the place with higher liq because of brokers and exchanges !
their profit is in trading fees so its obvious that they push the market to the liq zones to make move volume of trading and also more fee !

ETH/USDT | 4-Hour Rejection SetupThis ETH/USDT 4-hour chart highlights a potential short setup at a key supply zone and trendline resistance:
Entry: $3,308.15, anticipating rejection from the descending trendline and order block (OB) zone.
Stop-Loss: Placed at $3,370.88, above the OB zone for risk mitigation.
Take-Profit: Targeting the $3,147.00 level for potential gains.
The confluence of the OB zone and trendline resistance increases the probability of a price reversal, making this a well-structured trade. Confirmation from volume and candlestick patterns is recommended before entering.


ETH/USDTPotential 3-tap setup. The daily demand is holding the coin. In case of a drop below, a good buying price would be 2800-2300.
Growth targets:
Target 1 = 4120
Target 2 = 4870

Ethereum long tern price predictionEthereum makes a big cup and hande formation and cup formation is formed with reverse head and shoulder pattern. cup and handle price prediction is shown

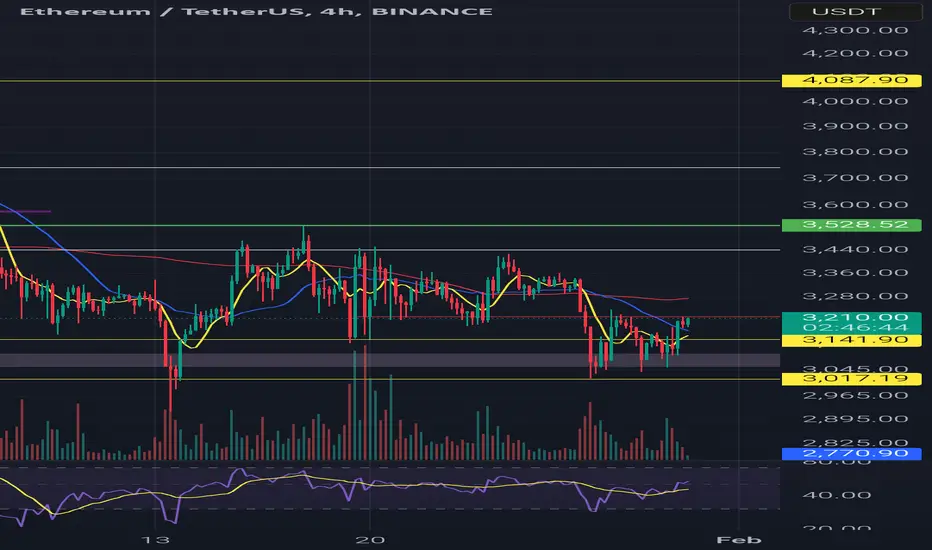
Ethereum/USDT Chart Analysis (4H )
1. Market Structure and Overall Trend
Current Price: 3206.46 USDT
The overall trend in the 4-hour timeframe is bearish, with temporary corrections toward resistance levels.
The price dropped after hitting 3528.52 USDT and is still moving below key moving averages.
2. Key Support and Resistance Levels
Support Levels:
3141.90 USDT (Medium-term support)
3017.19 USDT (Strong support with high probability of reaction)
Resistance Levels:
3206.46 USDT (Current resistance where the price is struggling to break)
3528.52 USDT (Major resistance in the overall trend)
3. Indicator Analysis
Moving Averages (MA):
The price is below the 200-period moving average, indicating selling pressure.
The short-term moving average (blue) is trending downward, confirming weak bullish momentum.
RSI:
RSI is between 40 and 50, showing a balance between buyers and sellers.
If RSI drops below 30, a bullish divergence could signal a potential buy opportunity.
4. Technical Patterns
Bearish Pattern:
A negative divergence at the previous high led to a price drop.
Possible Reversal Pattern:
If the price holds above 3141.90 USDT, a double-bottom pattern may form, pushing the price toward 3300 USDT.
---
Suggested Trading Plan
Long (Buy) Scenario
Entry: If the price stabilizes above 3206 USDT and breaks resistance with a strong confirmation candle.
Stop Loss: Below 3140 USDT (to reduce the risk of a false breakout).
Targets:
First target: 3300 USDT
Second target: 3528 USDT
Short (Sell) Scenario
Entry: If the 3141 USDT support breaks with a strong bearish candle.
Stop Loss: Above 3220 USDT (to avoid being stopped out on a false breakdown).
Targets:
First target: 3070 USDT
Second target: 3017 USDT
Conclusion
A breakout above 3206 USDT could trigger a short-term bullish move.
If 3141 USDT is lost, the price will likely drop to 3017 USDT.
As long as the price remains below the 200-period moving average, the overall trend remains bearish.
⚠ Recommendation: Always wait for confirmation signals before entering a trade and maintain a proper risk-to-reward ratio.
3200$ Crucial Resistance Is About To Break 📍 ETH Main Update
👉 Easy And Simple Setup For ETH, The Price Playing Below The Crucial 3200$ Resistance Area, In a Normal Situation Its Not a Good Idea To Be Bullish Below Resistances But As I See a Bullish Flag At The 1min Timeframe I Think The Price Is About To Breakout From 3200$
📈 Breakout From 3200$ Easily Will Pump The Price Toward a 3850$ And 4840$

ETH Bear Structure At Low Timeframe 👉 At Low Timeframe The ETH Price Formed a Bear Flag By The ABC Structure And There Is a Strong PRZ Formed At The 3200$ Area, For Me Its Better To Be More Caution In This Area Because Any Rejection From Here Will Cause a Corrective Move Toward a 2900$ Zone
📥 Scalp Traders Can Open a Short Here At 3190$ By The Tiny Stop Loss

ETH Rally Is About To StartThe Price Playing At The Bullish Flag And Also Yesterday We Had a Nice Bounce From 3050$ Support Area, My Expectation Is a Breakout From The Bullish Flag Toward a 3850$ And 4840$ As a Next Targets

Ready to flyHello again,
as i said at my previous post, we needed that support at 3K, thank god we got supported there.
now looking forward and hope to break the triangle area.
Next target is 4100-4500.

Ethereum (ETH): Will Move More Up / Waiting For ResistanceEthereum has reached a smaller resistance zone but not the one we are looking for!!
We are still waiting for smaller growth to happen on ETH, which would then possibly show us there a dominance from sellers, which then again would activate our Plan A.
So all attention to that resistance zone, which is near EMAs!
Swallow Team

ETH mid term Long + scalp short .ETH Move average is heavy and strong , im waiting for a short term scalp short for 1 percent and after that
Big move +20% percent swing Long
#ETH #long #midterm

ETHEREUM be Like - How much Miles before I go?You know patience? after patience comes holding ethereum lol. Aint seeing going 4300 now but yeah need two more such instances where it gets a rejction from PoC. I know i have drew snakes, but you know these show directions!

ETHUSDT 1DETH ~ 1D Analysis
#ETH In time frame 1D forms a bullish pattern, buy from here with a minimum target of 10%+
