ETHBULLUSDT trade ideas

ETHUSDT Daily Chart Analysis!!Join our community and start your crypto journey today for:
In-depth market analysis
Accurate trade setups
Early access to trending altcoins
Life-changing profit potential
Let' analyse ETHUSDT:
Ethereum has been following a clear market structure over the past few months, and the current setup hints at a potential trend reversal. Here's a breakdown:
Price Structure Breakdown:
1. Sideways Phase (Nov 2024 – Jan 2025):
ETH consolidated in a broad range with limited directional movement. Buyers and sellers were in equilibrium, setting the stage for a decisive move.
2. Downtrend Phase (Feb – Early April 2025):
A breakdown from the range initiated a sharp downtrend, forming a descending channel. ETH saw consistently lower highs and lower lows, fueled by macro uncertainty and weak demand.
3. Second Sideways Phase (Mid-April 2025):
After bottoming out, ETH began to consolidate again after breaking out of the descending channel, absorbing selling pressure and forming a potential accumulation zone.
What’s Happening Now?
ETH has broken out of the descending channel and is now attempting to reclaim the $1800 above zone, which earlier acted as support-turned-resistance. Sustained closing above this level would confirm the breakout.
If ETH holds above this breakout zone, we could see a shift toward a bullish market structure. The next targets are likely:
• $2,050 – key structural level
• $2,450 – confluence of resistance
• $2,750+ – breakout continuation zone
Trade strategy:
• Entry: On retest of the breakout zone ($1650–$1700)
• Invalidation: Close below $1600 (failed breakout)
• Targets: $2050 → $2450 → $2750
• Bias: Bullish until proven otherwise
If you find this analysis helpful, please hit the like button to support my content! Share your thoughts in the comments, and feel free to request any specific chart analysis you’d like to see.
Happy Trading!!

ETH - Those levels played out perfectly. I had given ETH TA days ago and updated it again and again.
Now: Look how those level played out nicely.
after a weekend and Easter days full of volatility
void level and last low was rejected very clearly and bullish Divergence in CVD.
Price came up above our 4h key level and went above last highs upper blue TL.
Here was a clear Entry for Long: Above blue TL, AVWAP and OBV structure was broken clearly.
to the POC : 5.5 % 🎯 👌
Look at previous ETH TA and more important at that TA about Alts 2 days ago:
Alts TA:
ETH TA:
Follow for more ideas/Signals.💲
Just donate some of your profit to Animal rights or other charity :)✌️


ETH SHORT SETUP ALL trading ideas have entry point + stop loss + take profit + Risk level.
hello Traders, here is the full analysis for this pair, let me know in the comment section below if you have any questions, the entry will be taken only if all rules of the strategies will be satisfied. I suggest you keep this pair on your watchlist and see if the rules of your strategy are satisfied. Please also refer to the Important Risk Notice linked below.
Disclaimer
ETH SHORT TRADE SETUP
ENTRY : 1949.24
PROFIT : 1725.06
STOP : 2020.31

Ethereum Eyes Bullish Momentum After Resistance BreakoutUpon a confirmed breakout above the resistance line, Ethereum will be well-positioned for a potential bullish move.

ETH SCENARIOS - LONG/SHORTThat's what I'm looking at in the near future.
Just some ideas :)
Crypto Introduction
Ethereum is a decentralized platform that runs smart contracts: applications that run exactly as programmed without any possibility of downtime, censorship, fraud or third party interference.
Will book 50% of short at 1:1RR (if given) to make it risk free.
Raw R:R is over 8 so there is room to play with.


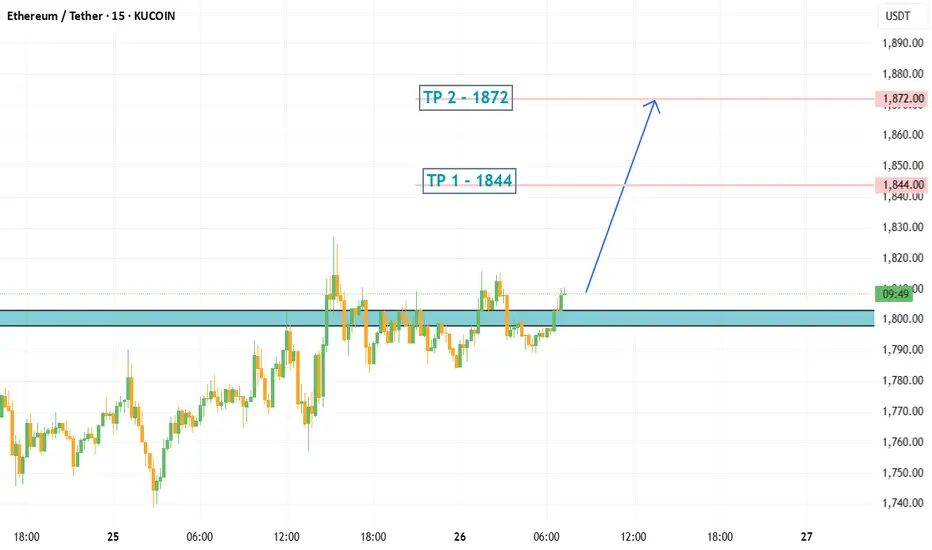
ETH/USDT LONG IDEAPosition opening range 1798~1803 USDT in batches
Total Position Recommendation Within 5% of total funds (or 1~2% of total account loss)
Stop Loss 1784 USDT, liquidate the position when triggered.
Take Profit First Target 1844, Second Target 1872
Cooling-off rule: 24 hours cooling-off after stop loss
Prohibition Prohibition of chasing high, prohibit the increase of positions, prohibit continuous trading
ETHUSDT Critical Rejection Zone | Bearish Outlook Towards 1672Ethereum (ETHUSDT) H4 Analysis: Bearish Outlook from Critical Resistance Zone
Overview:
Ethereum (ETH) is currently navigating a key resistance area between $1,788 and $1,814 on the 4-hour (H4) timeframe. After a strong bullish rally, the price action shows signs of exhaustion, suggesting a potential bearish reversal is developing.
Technical Analysis:
Critical Zone: The range of $1,788–$1,814 has emerged as a strong resistance. ETH has repeatedly tested this area without a decisive breakout, highlighting seller dominance.
Structure Break: The price has broken down from an ascending wedge/parallel channel structure, which typically signals a shift in momentum from bullish to bearish.
Moving Averages: ETH has recently fallen below the 50 EMA (orange line) and is now approaching the 200 EMA (green line). A sustained move below the 200 EMA would reinforce the bearish outlook.
RSI: The Relative Strength Index (RSI) is neutral around 50 but slightly tilting towards bearish territory. It indicates weakening buying pressure and a potential move towards oversold conditions if selling accelerates.
Volume Profile: The volume during recent pullbacks is higher than during bullish pushes, reflecting an increase in selling activity and reinforcing the probability of further downside.
Bearish Scenario:
As long as ETH remains below the $1,788–$1,814 zone, the broader expectation leans towards a bearish continuation. The next major areas of interest lie around $1,672 — a previous support and reaction level — and further down at $1,588, which aligns with a strong historical demand zone.
Conclusion:
ETH is at a decisive point. Failure to reclaim the $1,788–$1,814 resistance zone could pave the way for a larger bearish move in the coming sessions. Traders and investors should closely monitor price behavior around the 200 EMA and key support levels to assess the continuation potential.
#ETH #Ethereum #ETHUSDT #CryptoTrading #TechnicalAnalysis #BearishSetup #CryptoAnalysis #PriceAction #TradingView

ETH-----Sell around 1770, target 1700 areaTechnical analysis of ETH contract on April 24: Today, the large-cycle daily level closed with a small positive line yesterday, the K-line pattern continued to rise, the price was at a high level, and the attached indicator was running in a golden cross. The general trend of rising is relatively obvious, but there are two points we should pay attention to. First: After the current four-hour chart is under pressure, the K-line pattern is continuous and negative, the price is below the moving average, and the fast and slow lines of the attached indicator have signs of sticking and dead cross; Second: Yesterday's high did not continue, so a retracement and decline within the day is a high probability event; the short-cycle hourly chart did not continue to break upward after yesterday's price continued to fluctuate at a high level. Today, it began to retreat under pressure. The current price is below the moving average, and the attached indicator is running in a dead cross, so let's take a look at the strength of the decline within the day.
Today's ETH short-term contract trading strategy: Sell directly at the current price of 1770 area, stop loss in the 1800 area, and target the 1700 area;

HolderStat | What second top ETH holder do?He HOLD his position 7.02 ETH ~ 12 790 USD.
He know how to hold ETH/USDT for profit 😎
🧠This dude makes money by buying near a bottom and waiting for signs of a decline.
Statistic:
📥Invested($): 649
📈Profit ($): 41 820
💹Profit (%): 6448

ETH Key Support| Price Action| Trend| Bounce Continuation Ethereum saw a strong 7% bounce from daily support at $1,550, but the overall market structure remains bearish. Price now eyes the $2,000 resistance, which must be broken to confirm a structural shift.
Key Points:
- Bounce from $1,550 looks strong but lacks significant volume support.
- $2,000 is a key level — failure to break may lead back to $800 range lows.
Right now, this move should be treated as a reactive bounce, not a confirmed reversal. If ETH fails at $2,000, the downtrend likely resumes. But if it reclaims that level with strong momentum, we could see the first higher high in months.
Ethereum has bounced 7% from key daily support at $1,550, but bearish market structure still dominates. A break above $2,000 is needed to confirm a bullish shift. Until then, downside risks toward $800 remain.

#ETH Update – April 22, 2025
Current Price: $1,700.02 (+7.8%)
📊 Technical Snapshot
• Trend: Downtrend (last 4 months)
• Support: $1,500 & $1,350
• Resistance: $1,750 & $2,150
• Range: $1,557 – $1,630 → Moderate volatility
• ETH has dropped ~65% from its all-time high of $4,107
🔗 On-Chain Metrics
• Exchange Inflows: Large positive netflow to derivatives in March → Selling pressure
• Wallet Profitability: Only 20.94% of wallets in profit → Weak sentiment
• Active Addresses: Down to 400K from 650K → Lower usage
• Staked ETH: Over 25.6M ETH → Long-term confidence remains strong
🧭 Fundamentals
• SEC Approved ETH ETFs (no staking allowed) → Institutional inflow potential
• Galaxy Digital moved $100M from ETH to SOL → Institutional rotation
📈 Forecasts
• Short-Term (by Apr 27): ~$1,635.87 (−0.51%)
• Mid-Term (by May 22): ~$1,725.30 (+4.93%)
✅ Summary:
ETH is still in a downtrend, but fundamentals like staking and ETF approval show long-term strength. Short-term movement may be choppy. Watch $1,500 support and $1,750 resistance.


ETH swing Long IdeaI have in mind 2023 Lows, there is a weekly OB before it, so could provide some reaction, but ETH respects more high time frame S/R (support and resistance) so can provide a good trade for spot and perps

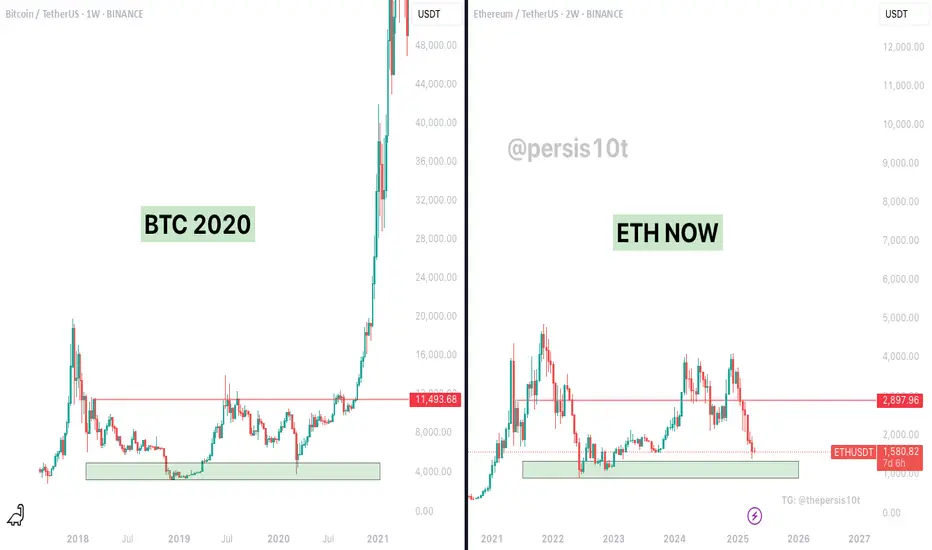
History Doesn’t Repeat, But It Often Rhymes – ETH = BTC 2020?On the left: BTC in 2020 before it exploded from ~$11K to $ 60 K+
On the right: ETH now, sitting on a similar macro support zone and showing a similar multi-year accumulation range.
This Chart Suggests:
BTC (2020) consolidated for years in a tight range between $3K and $ 12K before blasting off.
ETH has now spent over two years ranging between ~ $ 1K and $3K, forming a strong base at support just like BTC did.
The current ETH structure mirrors BTC's pre-bull breakout — clean support retest, fakeouts, and suppressed volatility.
If ETH follows a similar path, the next parabolic expansion could be approaching.
This isn't just about pattern recognition — it's about timing cycles, sentiment shifts, and institutional patience.
“The best trades often feel the most uncomfortable.”
While many are panicking, ETH is printing a macro setup that resembles the beginning of Bitcoin’s strongest run in history.
Are you prepared if ETH goes full BTC 2020 mode?
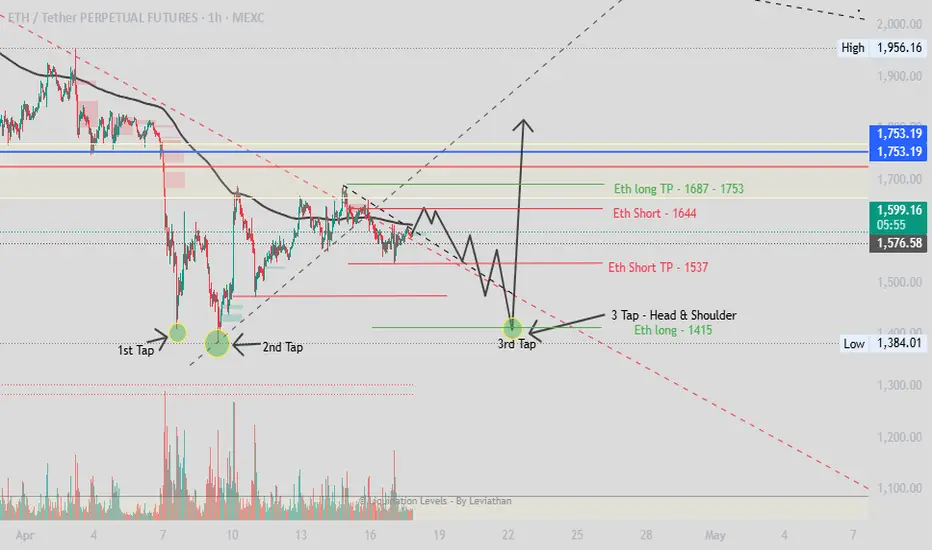
ETH - Short & Long Trades - All Upcoming Moves DefinedETH Short Trade:
After the break of ETH uptrend structure, topping at 1693 and making a local low at 1539, I would expect Eth to accumulate up to its supply zone at 1644 (Eth Short Entry Zone) before falling back down to 1537 (ETH Short TP Zone).
ETH Long Trade:
Looking at the previous lows, ETH has made two lows, 1st low at 1411, 2nd low at 1485, I would be expecting ETH to make another low at 1415 (ETH Long Entry) accomplishing the 3 Tap Pattern - Head & Shoulder. After this 3-Tap move is successfully completed, ETH should accumulate up to 1687 - 1753 (ETH Long TP Zone).
Ethereum: The biggest Opportunity in 2025!Ethereum is following Bitcoin—but with way worse performance. While BTC is still holding up relatively well, ETH has dropped all the way back to March 2023 levels, wiping out the entire rally. Since its top, Ethereum is down over 63%. 😮💨
Still—or maybe because of that—I’m beginning to slowly scale into spot positions here.
Yes, we could fall further. I’ve got limit orders set lower, specifically around $1,260, which aligns with the 88.2% Fibonacci retracement and the midpoint of the monthly order block. That’s a key zone I’ll be watching if price keeps dropping.
That said, this Wave (2) should be nearing its final stage. The sell-off has been steep, and if we lose $804, that would flip Ethereum’s entire monthly structure bearish—a scenario I’d consider extremely negative.
I don’t expect ETH to suddenly blast past $5,000 from here, but at these levels, I see a clear opportunity to build longer-term spot exposure—and that’s exactly what I’m starting to do now.

ETH/USDT Falling Wedge Breakout ETH/USDT Falling Wedge Breakout Summary
Ethereum (ETH) against Tether (USDT) has recently broken out of a falling wedge pattern, a bullish technical formation characterized by converging trendlines sloping downward, often signaling a reversal from a downtrend to an uptrend. This breakout, observed on the 12H chart, suggests potential for a significant rally as buying momentum increases.
Breakout Context:
The falling wedge formed as ETH consolidated, with lower highs and lower lows, indicating diminishing selling pressure.
A breakout above the upper trendline of the wedge, as noted in recent market analysis, confirms bullish sentiment, potentially driven by increased buying volume and market optimism.
Price Targets and Resistance Levels:
The breakout has set the stage for ETH/USDT to target several key resistance levels, based on technical analysis and historical price action:
$1,750: A near-term support-turned-resistance level, previously acting as a strong support zone. A retest or consolidation around this level may occur as the price stabilizes post-breakout.
$1,816 ($1,830 zone): This level aligns with a key support/resistance zone within the descending channel. Sustaining above this level is critical for confirming short-term bullish momentum.
$1,948 ($1,950): A significant resistance level identified in recent posts, marking the first major target post-breakout. Breaking this could accelerate upward momentum.
$2,119 ($2,120): The next resistance zone, aligning with prior highs and technical projections. This level may pose a challenge, requiring strong buying pressure to breach.
$2,777 ($2,800 zone): A longer-term target, potentially achievable if ETH breaks through the $2,200-$2,400 resistance zone. This aligns with projections for a rally toward $2,800-$3,000 if momentum persists.
Market Outlook:
Bullish Scenario: For the rally to continue, ETH must hold above $1,830 to confirm the breakout’s strength. A break above $2,200-$2,400 could pave the way for targets at $2,777 and potentially $3,000, as suggested by historical patterns and Fibonacci extensions.
Bearish Risks: Failure to sustain above $1,830 could lead to a pullback toward $1,750 or lower, with $1,600 as a critical support if the breakout fails. Rejection at higher resistance levels ($2,200-$2,400) may also trigger short-term corrections.
Indicators: Bullish divergence on RSI and weakening bearish momentum on MACD support the breakout’s validity, while the 50-day moving average acts as dynamic resistance above current levels.
Conclusion:
The ETH/USDT breakout from the falling wedge signals a bullish shift, with immediate resistance at $1,750 and $1,816, followed by higher targets at $1,948, $2,119, and $2,777. Traders should monitor volume and price action around $1,830 to confirm sustained momentum, while remaining cautious of potential rejections at key resistance zones. For real-time updates, platforms like TradingView or Binance’s ETH/USDT charts can provide further insights.

Short-term uptrend conversion point expected: 1647.06
Hello, traders.
If you "Follow", you can always get new information quickly.
Please also click "Boost".
Have a nice day today.
-------------------------------------
(ETHUSDT 1D chart)
The HA-Low indicator on the 1D chart is formed at the 1647.06 point.
Therefore, the key is whether it can receive support and rise near 1647.06.
-
However, since the M-Signal indicator on the 1M chart is falling near 2500, you should trade with a relaxed mind.
This is because in order to continue the uptrend, the price must be maintained above the M-Signal indicator on the 1M chart.
-
Since the M-Signal indicator on the 1D chart is passing near the HA-Low indicator on the 1D chart, if it rises above 1647.06 and maintains the price, it is likely to turn into a short-term uptrend.
Since the trend line is showing a downward channel and the StochRSI indicator is above 50, the increase is likely to be limited.
Therefore, when the StochRSI indicator shows an upward trend below 50, it is a buying period when the price is maintained above the HA-Low indicator.
If it rises above 1647.06 and continues to rise further, it is expected to touch the Fibonacci ratio of 0.618 (1868.21).
-
Thank you for reading to the end.
I hope you have a successful trade.
--------------------------------------------------
- This is an explanation of the big picture.
I used TradingView's INDEX chart to check the entire range of BTC.
I rewrote the previous chart to update it by touching the Fibonacci ratio range of 1.902 (101875.70) ~ 2 (106275.10).
(Previous BTCUSD 12M chart)
Looking at the big picture, it seems to have been following a pattern since 2015 and has been rising.
In other words, it is a pattern that maintains a 3-year uptrend and faces a 1-year downtrend.
Accordingly, the uptrend is expected to continue until 2025.
-
(Current BTCUSD 12M chart)
Based on the currently written Fibonacci ratio, it shows up to 3.618 (178910.15).
Fibonacci ratio 0.618 (44234.54) is not expected to fall again.
(BTCUSDT 12M chart)
I think it is around 42283.58 when looking at the BTCUSDT chart.
-
I will explain it again with the BTCUSD chart.
The Fibonacci ratio ranges marked in the light green boxes, 1.902 (101875.70) ~ 2 (106275.10) and 3 (151166.97) ~ 3.14 (157451.83), are expected to be important support and resistance ranges.
In other words, it seems likely to act as a volume profile range.
Therefore, in order to break through this section upward, I think the point to watch is whether it can rise with support near the Fibonacci ratios of 1.618 (89126.41) and 2.618 (134018.28).
Therefore, the maximum rising section in 2025 is expected to be the 3 (151166.97) ~ 3.14 (157451.83) section.
To do that, we need to look at whether it can rise with support near 2.618 (134018.28).
If it falls after the bull market in 2025, we don't know how far it will fall, but considering the previous decline, we expect it to fall by about -60% to -70%.
So, if the decline starts near the Fibonacci ratio 3.14 (157451.83), it seems likely that it will fall to around Fibonacci 0.618 (44234.54).
I will explain more details when the downtrend starts.
------------------------------------------------------

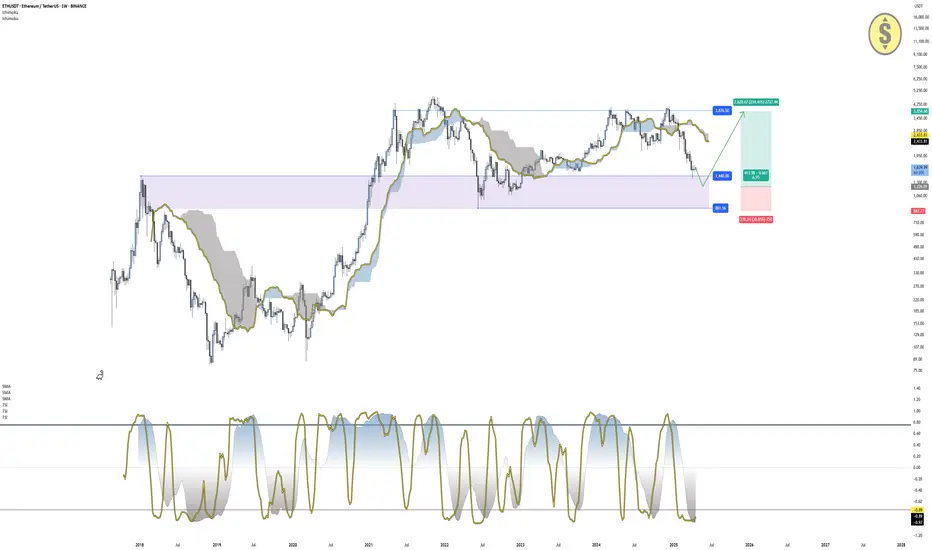
ETH/USDT Weekly – Approaching Key Accumulation ZoneEthereum is currently approaching a major support zone between $1,440 and $880, a level that acted as strong demand during previous market cycles. Price is currently below the Ichimoku cloud (Span A: $2,433 | Span B: $2,746), and the overall structure remains bearish unless price starts to break above recent swing highs.
Both Trend Strength Index (TSI) indicators are firmly in oversold territory:
TSI(10): -0.89
TSI(20): -0.97
This reflects deeply negative momentum, but historically, these levels have preceded strong reversals, especially when price enters high-timeframe support zones, like the one ETH is approaching now.
The $1,440–$880 range can be seen as a potential accumulation zone, and unless ETH breaks below $880, the bullish continuation setup remains valid. If price stabilizes here and begins reclaiming structure, especially above the $1,750–$1,950 levels, we could anticipate a move toward the $3,875 high or beyond.
Trade Setup Summary:
Accumulation Zone: $1,440 – $880
Invalidation: Break and close below $880
Bullish Trigger: Reclaim of recent swing highs
Target: $3,875 (major resistance)
Bias: Bullish while holding above $880
TSI: Deep oversold – conditions favorable for mid-term reversal
Ethereum fundamentals remain solid despite recent weakness. The upcoming upgrades to the Ethereum network (such as scalability and rollups) continue to support long-term utility, while institutional interest grows through ETH-based products and DeFi developments. Macroeconomic uncertainty, along with renewed ETF talks, could fuel a stronger recovery in the second half of the year. However, technicals must align with improving sentiment for this reversal setup to activate.
Disclaimer: This content is for educational and informational purposes only. It does not represent financial advice or a recommendation to buy or sell any financial instrument. Trading involves risk, and you should only trade with money you can afford to lose.
ETHUSDT Short TermEntry : 1618.80
Take Profit : 1673.54
Stop Loss : 1/2
Don't neglect to apply stop-loss!
