ETHBULLUSDT trade ideas
Ether long LTF long . Lets try to catch a local bottom . Very hard conditions to be honest.
Who would have thought that we would be fighting for this but here we are.
Nice rejection at the lows so far. Lets see and wait.


ETH USDT NEXT MOVESell after bearish candle stick pattern, buy after bullish candle stick pattern....
Best bullish pattern , engulfing candle or green hammer
Best bearish pattern , engulfing candle or red shooting star
NOTE: IF YOU CAN'T SEE ANY OF TOP PATTERN IN THE ZONE DO NOT ENTER
Stop lost before pattern
R/R %1/%3
Trade in 5 Min Timeframe, use signals for scalping

ETHUSDWith the weekly candlestick that closed last night,
There are no signs of weakness in the Ethereum chart and I expect to see a 1650 range based on the liquidity inflow chart.
Of course, this analysis is completely dependent on macroeconomic data and we will have to see what happens in the next few days with Mr. Trump's tariffs, unemployment rates, and the Fed meetings.
As always, we are moving in step with the market.
Best regards

Will Ethereum Survive This Critical Level?Ethereum (ETH/USDT) on the 12-hour timeframe is currently displaying a strong downtrend structure, highlighted by a well-defined rounded top pattern and a descending arc acting as dynamic resistance. Since reaching its peak above $4,000, ETH has consistently printed lower highs and lower lows, respecting this curved resistance line.
The price is currently trading around $1,887, testing a significant horizontal support zone near $1,880–$1,900. This level has held multiple times in the past and now serves as a crucial line in the sand for bulls. If this support fails to hold, Ethereum could see further downside toward the next demand zones around $1,700 or even $1,600.
The RSI indicator stands at 36.11, which suggests that momentum is weak and the asset is nearing oversold territory. While this can often lead to short-term relief bounces, the overall trend remains bearish unless ETH breaks above the descending arc and reclaims key resistance levels near $2,050. A bullish scenario would require strong buying volume and a structure shift to higher highs

Ethereum - take trades at key levelsEthereum - take trades at key levels
Long at 1820, 1750 and 1950 in a case of structure breakout
best short at 1950 or at 2150


#ETHUSDT is showing a reversal pattern📊 BYBIT:ETHUSDT.P is showing a reversal pattern — we expect the uptrend to continue if the breakout level holds!
🕒 Timeframe: 4H
➡️ BYBIT:ETHUSDT.P has formed a potential Double Bottom (Bottom 1 and Bottom 2) around $1,785–$1,809, indicating a possible trend reversal.
➡️ The key trading range (POC — Point of Control) is at $1,881.71, making it a major resistance level.
➡️ The price is also bouncing off the support zone, which aligns with the previous consolidation area.
➡️ Volume is increasing during the bounce, confirming buyers’ interest.
⚡️ Considering a potential long entry
⚡️ Maximum target based on the pattern — $2,522
📍 A breakout and hold above $1,849.71 will confirm the bullish scenario and attract more long liquidity.
📢 If the price drops below $1,785, the setup will be invalidated — high chance of a continued downtrend.
📢 The rise of BYBIT:ETHUSDT.P is possible due to reactions to the strong support zone and the forming Double Bottom pattern.
🕒 Timeframe: 1H
➡️ BYBIT:ETHUSDT.P has formed a Falling Wedge , which is a bullish pattern.
➡️ A second bottom ( Bottom 2 ) has formed, confirming a potential reversal.
➡️ The upper boundary of the wedge has already been broken, accompanied by a spike in volume.
➡️ A strong consolidation zone exists around $1,808–$1,820 — a retest could confirm a long entry.
⚡️ Holding above the wedge breakout is a signal for further upside.
📢 If the price falls back below $1,800 and buying momentum weakens — the scenario should be reconsidered.
📉 LONG BYBIT:ETHUSDT.P from $1851.0
🛡 Stop loss: $1835.00
🕒 Timeframe: 1H
🎯 Targets (TP):
💎 TP 1: $1860.00
💎 TP 2: $1871.00
💎 TP 3: $1882.00
💎 TP 4 (long-term target): $1890.00
🚀 BYBIT:ETHUSDT.P is maintaining a potential reversal pattern — we expect upward movement if volume confirms!

ETH: Possible Scenario!Hello Traders,
Here's a quick update on ETH in the weekly timeframe.
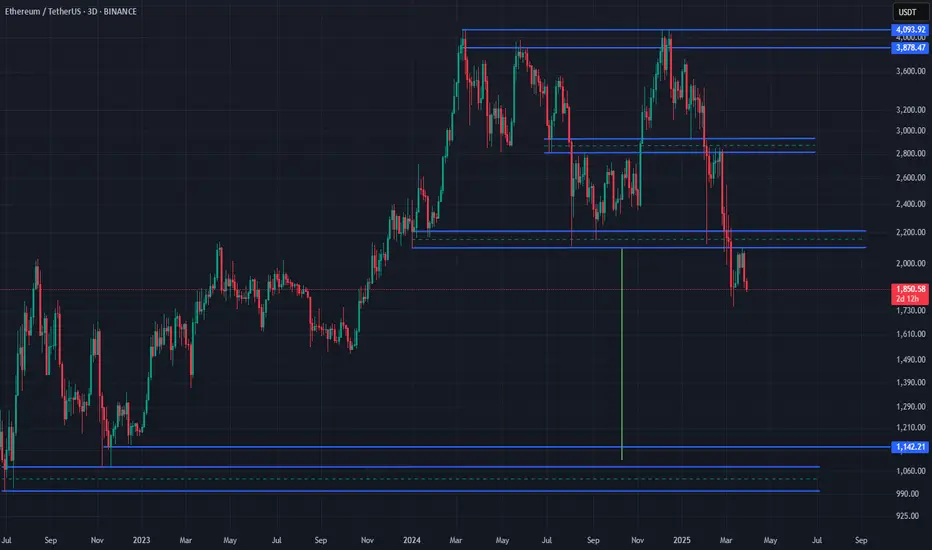
ETH is currently in a downtrend, trading at $1,890. It has already faced a 57% drop, and the trend is likely to continue.
Based on this weekly analysis, I expect ETH to drop to $1,400, where we have a support level. In a worst-case scenario, it could fall to $1,000. A rebound toward $2,200 is possible from the current market price, but it may not sustain for long.
Conclusion:
✅ Potential Accumulation Range: $1,000 - $1,400
✅ Lower Support: $1,000
Note: Always do your own research and analysis before investing.

Ethereum Wave Analysis – 28 March 2025
- Ethereum reversed from the resistance level 2120.00
- Likely to fall to support level 1800.00
Ethereum cryptocurrency recently reversed down from the resistance level 2120.00 (former multi-month support from August and February) standing near the 38.2% Fibonacci correction of the downward impulse from February.
The downward reversal from the resistance level 2120.00 stopped the previous ABC correction ii.
Given the strong daily downtrend, Ethereum cryptocurrency can be expected to fall to the next support level 1800.00 (which stopped the previous impulse wave i).

ETH as well in a big opportunity as btc eth is in a big ascendant channel, where is formed a big falling wedge inside the channel, we are now on the support of the channel and of the wedge, so should be a nice level hard to let it down, there is even fib retracement to fill the gap formed, so i expect eth a nice move of 20/30% if trump doesnt say shit as every day of his life !!! trade safe and open a max leverage of 10x

ETH UPDATEETH bounced off the important resistance at 2030. It will either go to 2150 or back to the channel bottom. What do you think?

ETHUSDT NEXT MOVESell after bearish candle stick pattern, buy after bullish candle stick pattern....
Best bullish pattern , engulfing candle or green hammer
Best bearish pattern , engulfing candle or red shooting star
NOTE: IF YOU CAN'T SEE ANY OF TOP PATTERN IN THE ZONE DO NOT ENTER
Stop lost before pattern
R/R %1/%3
Trade in 5 Min Timeframe, use signals for scalping

ETH USDT Critical Support Under PressureThe analysis for ETHUSDT on the 4-hour timeframe indicates significant bearish pressure as the price approaches a well-defined support zone, where a potential bullish reversal reaction from buyers can be anticipated. Scenarios include either a bounce from the support level with subsequent growth towards the upper resistance zone or a breakdown below, which could signal further trend weakening.

Right now is the best time to be accumulating $ETH.Repeating Market Cycles (ChartPrime Indicator):
The ChartPrime oscillator shows a recurring pattern of market lows around the green-marked dates:
June 13, 2022 (Bear market bottom)
September 11, 2023 (Temporary low)
August 19, 2024 (Another correction)
March 24, 2025 (Potential bottom forming)
If this pattern holds, ETH could be near a cycle low, signaling a potential reversal soon.
Indicators Confirm Oversold Conditions:
The oscillator is near the lower green zone, historically aligning with market bottoms.
Past similar signals led to strong recoveries after a consolidation phase.

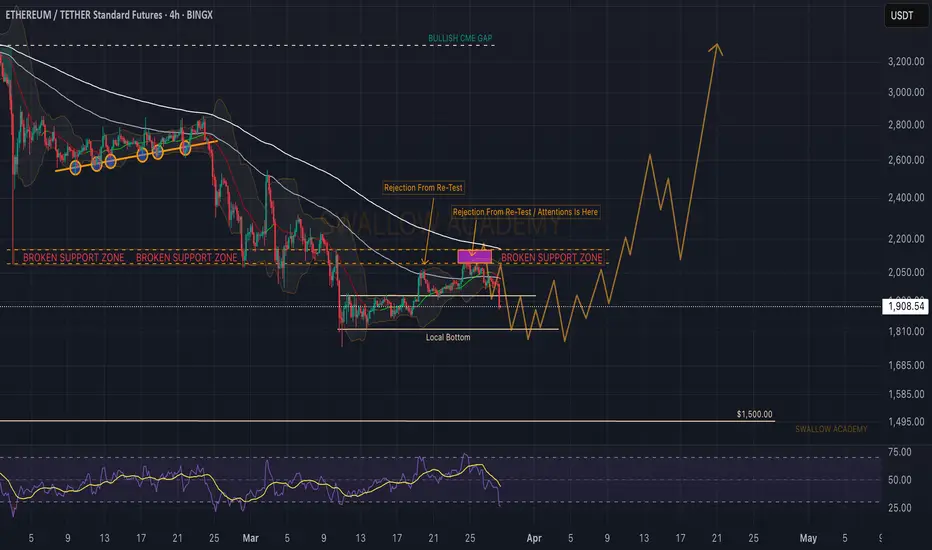
Ethereum (ETH): Strong Rejection From Re-Test ZoneWe are seeing strong rejection from the local re-test zone, where we are aiming now to see a further drop until the $1,820, where we expect to see some kind of support to form.
Once we see the support zone form there, we will be looking for upward movement, but for now let's bleed a little bit more.
Swallow Team
ETH Rising Wedge: Are We Headed for a Bearish BreakdownHey traders! 👋
We’re seeing a rising wedge pattern on ETH, which is generally considered a bearish setup. 📉 We’ve also had a solid touch at the Fib 0.382, which is acting as strong resistance right now.
With that in mind, we’re opening a market order and targeting the daily FVG (Fair Value Gap) for the next move down. What’s even more interesting is that our eclipse indicator is showing bearish signals across all timeframes, adding even more weight to the trade. 🛑
We’re going for it—how about you? Let’s see how this plays out! 💪
Note: This is not financial advice. Always do your own research before making any trading decisions!

ETH - As long as the $1,950 holds...Hello TradingView Family / Fellow Traders. This is Richard, also known as theSignalyst.
📈After breaking above the $2,000 level, ETH has been overall bullish trading within the rising orange channel.
Moreover, it is retesting as strong support zone, so we will be looking for longs as long as the $1,950 level holds.
🏹 Thus, the highlighted blue circle is a strong area to look for buy setups as it is the intersection of support and lower orange trendline acting as a non-horizontal support.
📚 As per my trading style:
As #ETH approaches the blue arrow zone, I will be looking for bullish reversal setups (like a double bottom pattern, trendline break , and so on...)
📚 Always follow your trading plan regarding entry, risk management, and trade management.
Good luck!
All Strategies Are Good; If Managed Properly!
~Rich

Etherem impulse trade - coming soon BULLISHI think Ethereum is now really underrated and will make big move in the next weeks! Check this out.

Can $1900 be Ethereum’s next stop after brutal dip?Hello and greetings to all the crypto enthusiasts, ✌
All previous targets were nailed ✅! Now, let’s dive into a full analysis of the upcoming price potential for Ethereum 🔍📈.
Ethereum is currently trading within a descending channel and has undergone a significant, seemingly unbounded decline. However, it is approaching a key support zone that could potentially trigger a reversal. While the next major move remains uncertain, I am anticipating a potential upward correction of approximately 18%, targeting the $1,900 level—warranting a fresh evaluation of the market landscape.📚🙌
🧨 Our team's main opinion is: 🧨
Ethereum’s been sliding in a downtrend, but with strong support nearby, I’m eyeing a possible 18% bounce toward $1900—time to reassess the market.📚🎇
Give me some energy !!
✨We invest hours crafting valuable ideas, and your support means everything—feel free to ask questions in the comments! 😊💬
Cheers, Mad Whale. 🐋

Symmetrical triangle Formation..!!CRYPTOCAP:ETH is currently sitting just above the lower trendline,which has been respected since mid-2022✅
These kinds of patterns can lead to explosive Bullish Rally...📈

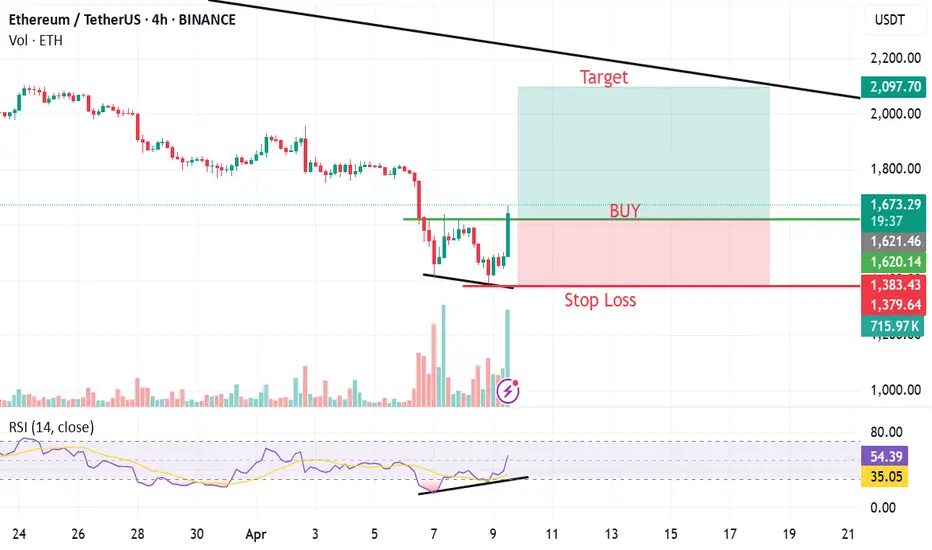
ETHUSDTBullish reversal at 4hr TF. Buy above 1620 with a SL below 1380.
Target should be around 2100.