ETHUSDT Finally breaks long term wedge patternThis is dangerous for ETH this is a madness, we may meet the targets of 1200 or even all the way through 800 bucks in this
ETHBULLUSDT trade ideas


Sell ethHello friends, I predict the same analysis for Ethereum in the future. If Ethereum loses this support at 1500, the next target will be $1000._900$

ETHUSDT 4H | CONSOLIDATION Break UP or DOWN?
From the ETH/USDT (Ethereum) chart on the 4H (4-hour) timeframe you see, here’s a brief analysis of the support and resistance levels based on the existing price structure and horizontal lines:
1. Support:
• Main support around $1,751
This is visible from the purple horizontal line and previous price reactions that rejected further downside in this area.
• Minor support around $1,578 – $1,580
This area is marked below (also seen as a previous reaction zone). If the $1,751 support breaks, the price is likely to move toward this area.
2. Resistance:
• Strong resistance around $2,280 – $2,300
Marked by the thick purple horizontal line at the top. This is a significant area from a previous supply zone and could be a potential target if the price breaks upward.
• Minor resistance in the FVG 4H area (around $1,880 – $1,900)
This Fair Value Gap area could act as a balanced zone that often attracts price for a retest.
• Dynamic resistance:
• 200 MA (orange curved line): currently may also act as a dynamic resistance level.
Summary:
• The price is currently in a sideways/consolidation phase above the $1,751 support level.
• It’s important to watch whether the price will bounce from support or break downward toward $1,580.
• If the price starts to rise, the FVG 4H zone could be a short-term target, with the major resistance at $2,280 as the next potential target.
Remember trading is to manage your risk & reward
so do your own research

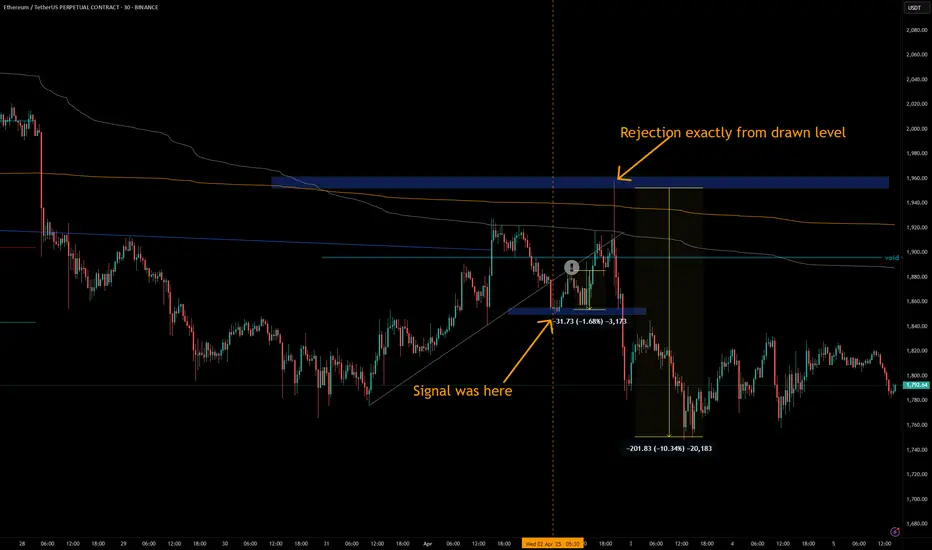
ETH - Excellent Signal/TA two days ago.I again gave my levels for ETH and got a hilarious reactions on my levels :)
1️⃣) A nice reaction on grey trend line which was marked grey .
Reject exactly from where I wanted 👌 🎯.
💵💲 1.6 %
2️⃣) How my blue box was rejected. Just perfect. I was awaiting that manipulation big red wick to my upper blue box👌🎯 . Crypto movement was way too healthy in last weeks.
That rejection gave over 10 % 💵💲 .
3️⃣) I opened a short right under the grey TL and the grey AVWAP. 👌 🎯
Here my Original Signal:
Follow for more ideas/Signals. 💲
Look at my other ideas 😉
Just donate some of your profit to Animal rights and rescue or other charity :)✌️
ETH-----Sell around 1810, target 1750 areaTechnical analysis of ETH contract on April 5: Today, the large-cycle daily line level closed with a small negative line yesterday, and the K-line pattern continued to fall. The price was below the moving average. The fast and slow lines of the attached indicator were glued together and flattened. From this point of view, the time happened to be on the weekend, and the weekend was mainly focused on corrections. So can we predict whether the trend of the second big drop will continue next week? Let's wait and see; the short-cycle hourly chart was under pressure in the early morning, and the K-line pattern showed continuous negative lines. The attached indicator was dead cross running, and the high point of the correction was near the 1836 area. From the perspective of various technical indicators, the current decline will continue, but the strength will not be very large.
Therefore, today's ETH short-term contract trading strategy: sell directly at the current price of 1813 area, stop loss in the 1843 area, and target the 1750 area;

ETHUSDT Chart Analysis (as of April 5, 2025)📉 General Trend:
Ethereum is in a clear and strong downtrend since the peak around $4,042 (early 2024).
A series of BOS (Break of Structure) and CHoCH (Change of Character) to the downside confirm bearish control.
A recent BOS below a weak low indicates further downside pressure.
🔍 Support and Resistance Levels:
🔵 Support:
$1,592 – 0% Fibonacci level, a critical low. A breakdown could lead to $1,300 or even $1,000.
$1,720–$1,760 – Minor support zone before the low.
$1,300–$1,400 – Historical demand block.
🔴 Resistance:
$2,170 – 23.6% Fibonacci retracement.
$2,400 – Order block and strong resistance area.
$2,817 – 50% Fibonacci level.
$3,512 – 78.6% Fibonacci retracement.
$4,042 – Previous strong high.
🎯 Short-Term Outlook (Next 1–2 Days):
Likely trading range:
Downside target: ~$1,750
Upside target: ~$2,000–$2,050 (resistance zone)
📉 Short Setup:
Entry: $2,000–$2,050 (resistance block + bearish confirmation)
Take Profit: $1,750–$1,720
Stop Loss: Above $2,100
Risk/Reward Ratio (RRR): ≈ 1:2.5
Trigger: Rejection pattern (e.g., Bearish Engulfing or Shooting Star)
📈 Long Setup:
Entry: Around $1,600–$1,620 (support zone with confirmation)
Take Profit: $1,950–$2,000
Stop Loss: Below $1,580
Risk/Reward Ratio (RRR): ≈ 1:2
Trigger: Bullish hammer + increasing volume
🔻 Lowest Expected Price:
If the $1,592 level breaks, next strong support lies between $1,300–$1,400, with potential to drop as low as $1,000 in a worst-case macro scenario.
🔁 Expected Reversal Area:
A potential bullish reversal might happen at $1,592 if a bullish structure break or confirmation candle appears.
An early reversal could occur if price breaks and holds above $2,200 with strong bullish momentum.
🧠 Additional Notes:
ETH currently appears weaker compared to BTC.
A comparison with the ETH/BTC pair might reveal whether it’s a better time to hold BTC over ETH.
Rallies are likely to be used by bears for shorting unless significant structure changes occur.

Ethereum TA 25.4.5Hello everyone, I hope you are doing well. Ethereum on the 4-hour timeframe got rejected after hitting a strong order block and started forming new lows. Given the current chart conditions, we have two order blocks in the high price area and we expect the price to return to these levels. If we see a short setup, we will enter a short position with a target of 1750. For now, I am not suggesting a long position and will wait until the pullback on the chart is complete.
⚠️ This Analysis will be updated ...
👤 Sadegh Ahmadi: GPTradersHub
📅 25.Apr.5
⚠️(DYOR)
❤️ If you apperciate my work , Please like and comment , It Keeps me motivated to do better

Multiple resistance tests in a fully formed falling wedge As we can see right here, there has been multiple touchdowns in the upper trend line of the huge falling wedge. This might indicate a break above and retest and going forward. Even there are some pretty decent bullish divergences on lower time frames as well.

Very nice long position on ETHAll is on the chart, we can try a long from here because there is an old restance trend line that is becomed a very good support, after tht we have in green rectangle forming a good support for eth, max leverage 10x even if i suggest 5x, please let me know what you think, last idea on ETH was a falling wedge and i did a big profit with 10k leveraged x10, let me know what do you think guys?? thanks a good monet for everybody

ETHUSDT NEXT MOVESell after bearish candle stick pattern, buy after bullish candle stick pattern....
Best bullish pattern , engulfing candle or green hammer
Best bearish pattern , engulfing candle or red shooting star
NOTE: IF YOU CAN'T SEE ANY OF TOP PATTERN IN THE ZONE DO NOT ENTER
Stop lost before pattern
R/R %1/%3
Trade in 5 Min Timeframe, use signals for scalping

ETH-----Sell around 1825, target 1750 areaTechnical analysis of ETH contract on April 4: Today, the daily level of the large cycle closed with a small positive line yesterday, and the K-line pattern was a single positive line with continuous negative lines. The price is still below the moving average and is obviously suppressed. The fast and slow lines of the attached indicator continue to close negative today, so the pattern will cross downward. Therefore, the general trend remains unchanged and continues to be bearish. Trading remains short-term and risk control is done well; the short-term price decline yesterday broke the previous low of 1750, but did not continue. The current price fluctuates within the range and there is not much movement. From the perspective of various technical indicators, the four-hour chart is a continuous negative line, and the intraday price is suppressed, so the trend is still bearish, and the previous correction high is near 1850.
Today's ETH short-term contract trading strategy: sell at the 1825 area, stop loss at the 1855 area, and target the 1750 area;

#ETH #ETHUSDT #ETHEREUM #LONG #SWING #Analysis #Setup #Eddy#ETH #ETHUSDT #ETHEREUM #LONG #SWING #Analysis #Setup #Eddy
ETHUSDT.P Swing Long Analysis & Setup
Important area of the upper time frame for swing are identified and named.
This setup is based on a combination of different styles, including the volume style with the ict style.
Based on your strategy and style, get the necessary confirmations for this Swing Setup to enter the trade.
Don't forget risk and capital management.
The entry point, take profit point, and stop loss point are indicated on the chart along with their amounts.
The responsibility for the transaction is yours and I have no responsibility for not observing your risk and capital management.
🗒 Note: The price can go much higher than the second target, and there is a possibility of a 500% pump on this currency. By observing risk and capital management, obtaining the necessary approvals, and saving profits in the targets, you can keep it for the pump.
⚠️ Warning : The stop loss is dramatic and large. Place the stop loss based on your strategy and after getting entry and confirmation on the entry point behind the last shadow that will be created. (( This is just my opinion and is not meant to be 100% correct, so be careful with your capital. ))
Spot Investing : ((long 'buy' position)) :
🟢 Entry 1 : 1800
🟢 Entry 2 : 1500
First entry point calculations :
⚪️ SL : 1370 ((23.89%))
⚫️ TP1 : 4500 ((150%))
⚫️ TP2 : 5000 ((177.78%))
⚫️ TP3 : 8000 ((344.44%))
⚫️ TP4 : 10000 ((455.56%))
‼️ Futures Trading Suggested Leverages : 3-5-7
The World Let it be Remembered...
Dr. #Eddy Sunshine
4/4/2025
Be successful and profitable.
Do you remember my first Ethereum swing long signal?
My first swing long signal was provided on Ethereum, which was spot pumped by more than 100% and was profitable :

1:3 RR ETH SHORTI just found it as a good trade
ETH needs more Liquidity so I prefer to sell instead of buy
Good Luck

Ehtereum (ETH) - Entered Long based on Lesson 15Lesson 15 Methodology;
1.Support Level
2. Largest Down wave after a while (Buyers possible entering)
3. Placed AVWAP and wait to cross upwards and pullback
4. Enter on Plutus signal Long in this case PL

Divergences Everywhere — Bears Want You Out! Hello Traders 🐺
This is a short and quick emergency update for ETH, because I personally think that we are about to see a massive reversal in the market, especially in the Altcoin section:
1_ Falling wedge: ETH is inside a falling wedge pattern just like BTC. They have the same pattern and also we have clear signs of bottoming out for both of them.
2_ Bullish divergence on the Daily chart: If you pay close attention to the RSI, you can see that we have a massive bullish divergence and this means breakout is so imminent for ETH, and this is going to be to the upside rather than downside, because honestly we are about 60% down from the ATH price — which in my opinion is enough correction for bulls to come back and take control.
3_ BTC.D is about to top out: If you saw my last idea about it, you know that we have a very huge bullish divergence — not on the daily, not even on the weekly! We have it on the monthly chart!!! That's f..king enough to be extremely bearish on BTC.D and be over bullish on ETH and Alts as well.
4_ ETH/BTC is very close to the monthly support and demand area: I will publish a complete idea about it because this is beyond the current idea and I have to explain it in detail.
Oh right guys, I hope you make the right decision — and also always remember:
🐺 Discipline is rarely enjoyable, But almost always profitable 🐺
🐺 KIU_COIN 🐺

Ethereum (ETH): Losing Important Zones, We Might Fall To $1,500This last couple of months has been really hard for Ethereum, where we saw ay ATHs and currently we are not seeing any proper signs of recovery where usually after Bitcoin market dominance the volume flows into Ethereum.
Nevertheless, while we see a chance that price will dip more down, we are still looking for a recovery here.
Our points of interest are both the $1,900 zone and the $1,500 zone, where most of the liquidity is lying currently. As long as we are above $1500, we are bullish on Ethereum, but currently we see how weak the markets are so we wait for proper support to form!
Swallow Team

Ethereum (ETH): Most Important Zone For EthereumWe are in one of the most important zones for Ethereum, where we are looking for 2 possible scenarios currently.
1) Ideally we should see a buying volume to build from here, which would give us a good buying opportunity once we see an MSB to form on smaller timeframes.
2) If sellers keep this kind of dominance, we will fall to a lower size of our zone, which is $1,500.
Currently, Monday has been pretty weak so we might have to wait more for a proper support zone to form but keep your eyes on EMAs; they are way too far from the market price, which usually means a possible quick movement can happen!
Swallow Team

Ethereum (ETH): Price Struggles To Establish Support Zone.As we monitor the markets, ethereum has dipped nicely to our second bottom, but we got close to our sell entry zone here, which is showing the great dominance of sellers.
As we enter the weekend market, we most probably will see some volatility, but nevertheless, we wait for one of our entries to be broken and secured (properly re-tested).
Swallow Academy

ETH strong byhistory repeats itself - the main postulate of market analysis. Here I see a standard scheme for capturing liquidity. A level is created behind which market participants place stop orders. As soon as a large number of them accumulate there, the price breaks through this level, collecting liquidity. With a sharp return behind the level. This is how bitcoin turned around from 16k

ETH/USDT:UPDATEHello dear friends
Given the price drop we had, a head and shoulders pattern has formed within the specified support range, indicating the entry of buyers.
Now, given the good support of buyers for the price, we can buy in steps with capital and risk management and move towards the specified targets.
*Trade safely with us*

Is Ethereum dying?Ethereum is expected to fall to $1,000 support after breaking its dynamic support line and if there is no support at this price, it will drop to $100

FALLLLLLLIIIING ETHUSD.PDoes not need any descriptions... :)
the target level is the level of unfilled orders remains from old days ...
