Ethereum trading around good supportOn Linear scale chart, ETHUSD is around the support zone working since 2020. there is another parallel channel working.
ETHUSD.P trade ideas

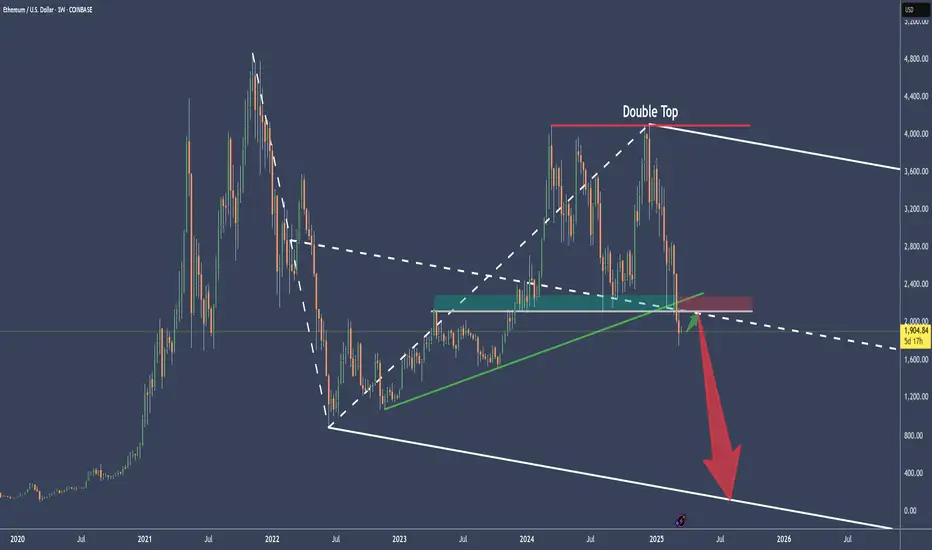
ETHUSD Cracked the longterm supportFirst there was the Double-Top.
Then there was no higher close above the last 2 highs, pressing ETHUSD brutally down to fullfill the Medianlines Rule to reach the Center-Line over 80% of times.
Then price not only reached the Center-Line by breaking through the slanted green support, but also cracked through the weekly horizontal Base (grey) which acted as the last support Bastion.
There are two scenarios possible.
a) a pullback, jump above the CL and we will see a moonshot.
or
b) price is retracing the Center-Line as it does most of the time after it's break, and then continues to the downside. Target would be the Lower-Medianline-Parallel.
ETHUSDETHUSD
After a fake breakout once it has breakout the Lower Trend Line of the Consolidation Phase. It has completed the Impulsive Waves " 12345 " will make its Corrective Waves " ABC " and retracement for the Breakout
Note :
This is only the Technical Analysis for Ethereum Next Possible move , It is not the Proper Signal

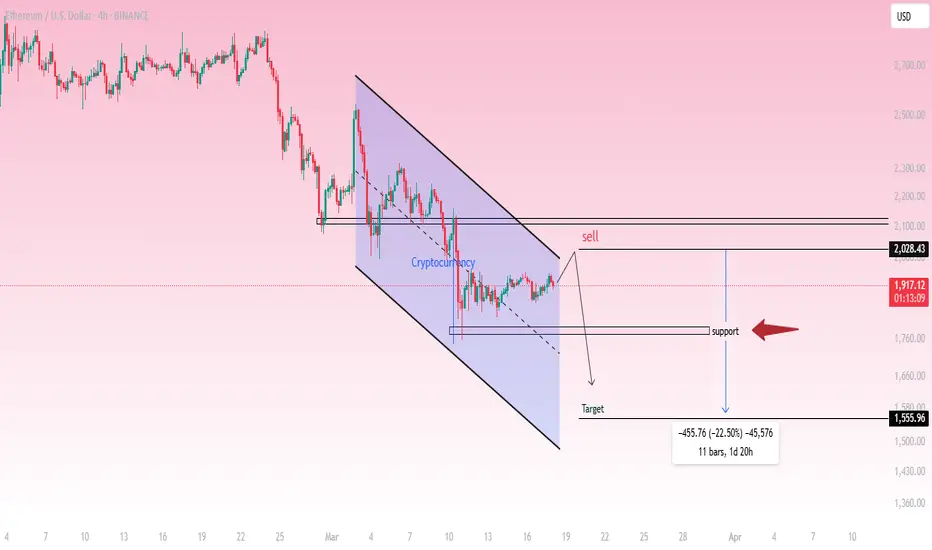
Ethereum (ETH/USD) - 4H Analysis & Trade Setup
Market Overview:
ETH/USD is in a downtrend, forming a descending channel.
Price is currently trading around $1,915.23, showing signs of consolidation near resistance.
Technical Analysis:
Trend: Bearish
Resistance Level: $2,028.43
Support Level: $1,760
Target: $1,555.96
Pattern: Descending Channel
Trade Idea (Short Setup):
🔴 Sell Zone: Around $2,028.43 (Resistance)
✅ Target: $1,555.96 (-22.50%)
⛔ Invalidation: A breakout above $2,028
Conclusion:
Ethereum is respecting the downward channel structure.
A rejection from resistance at $2,028 could confirm further downside.
Traders may consider short positions targeting $1,555.96, provided the trend remains bearish.
📉 Bearish bias remains intact unless price breaks above resistance.
The current ETH chart, incorporating my 'flash-crash' thesisThis chart illustrates the current ETH pattern, with my 'April flash crash thesis.'
I believe we will see another thrust lower into the marked lower ranges before a spring into the fifth wave. However, the fifth wave will be a "false breakout," as a flash crash in mid to late April is likely to occur, intentionally designed to sweep liquidity by liquidating overleveraged positions and triggering stop losses—only for the market to recover shortly thereafter and continue its breakout to the upside. This breakout will likely push beyond the pattern and take out the "Trump Election Pump" highs.
There could be some opportunities in the next 4 to 6 weeks, but with opportunity comes risk. Always use a proper risk management strategy suited to your skill level and wallet size.
Good luck, and always use a stop loss!

Selling ETH for a quick Short term drop to 1910 Levels Looking for some profit taking on this retrace in ETH .Selling at 1945
Stop at 1980 Target 1910
Testing format , any ideas for style greatly appreciated . Thanks

ETH, Consolidation and Bullish Divergence, Bullish move expectedLong Consolidation Sharp Downtrend
Trendline resistance broken
Bullish Divergence
Bullish move expected
FOMC meeting and rate cut can bring further rally this week
Take profit if no rate cut and exit
Buy on closing above 1970
Stoploss below 1820
TP at mentioned levels

ETHUSD BEARISH We back again with nice setup down we go without looking at the back, bearish movement to the support level.

BULLISH SCENARIOI'm seeing an ABCD Bullish Harmonic Pattern. I think more downside is coming for ETH. I'm not seeing any momentum as of the moment to pull things off for ETH.

The Forecast of ETHUSD TrendETH is currently hovering around $1,900. There is obvious resistance at $1,920 above, and $1,870 below is a key support level. If it breaks through the resistance, it is expected to reach for $2,000; if it falls below the support, it may drop to $1,850.
ETHUSD
sell@1920-1940
buy@1850-1870
I have been engaged in the trading field for nine years.
Up to now, the profit I have made has exceeded one million US dollars.
If you want to obtain professional guidance on trading trend analysis, trading strategy formulation, and risk management, please click on my profile.

Ethereum at a Turning Point: History Repeating?Ethereum is currently at a decisive moment, sitting at a major support level that has historically played a crucial role in determining the market’s direction. The parallels to 2021 are striking. Back then, ETH experienced a deep correction of over 60 percent after reaching its cycle high. However, once it found support in a key liquidity zone, it staged an explosive rally, gaining over 175 percent in just a few months. Now, in 2025, we are seeing an almost identical setup. ETH has once again corrected significantly from its recent highs, dropping nearly 58 percent, and is now testing the same kind of structural support that previously acted as a springboard for a new bull run.
The technicals indicate that this support level is not just any ordinary price zone. It coincides with the 200-week exponential moving average, a historically strong dynamic support level that has often marked the bottom of major corrections. Additionally, this region aligns with a previously established demand zone that saw significant buying interest in the past. The fact that ETH is testing this support right before a major macroeconomic event makes this moment even more critical. On March 19, the Federal Reserve is set to announce its latest interest rate decision, which could have a direct impact on liquidity conditions across all markets, including crypto.
If Ethereum manages to hold this level and bounce, the upside potential could be significant. The first major resistance to overcome would be around 3929, a level that previously acted as a rejection zone during the last cycle. A breakout above that level could open the door for a move towards 4875, which represents a key structural resistance and would put ETH back in a strong bullish trend. A repeat of the 2021 pattern could mean that ETH is on the verge of another parabolic move.
However, the bearish scenario cannot be ignored. If this support fails and ETH breaks below this critical zone, it would be a major warning sign. A breakdown could trigger further downside pressure, potentially leading to a deeper correction and confirming a bearish trend. This could mean that Ethereum enters an extended bear market, with the next significant support levels much lower. The rejection at resistance, followed by a lower high, would suggest that sellers remain in control, and without strong bullish catalysts, a further decline would be the path of least resistance.
Beyond technicals, fundamentals are playing an equally important role. The crypto market has been increasingly correlated with traditional finance, and with the Federal Reserve’s decision just days away, investors are watching closely. If the Fed signals continued monetary tightening or delays interest rate cuts, risk assets like Ethereum could face further downside. On the other hand, a more dovish stance from the Fed could inject fresh liquidity into the market, acting as a catalyst for ETH to reclaim higher levels.
Sentiment in the crypto space is also crucial. On-chain data suggests that long-term holders are still accumulating, which indicates confidence in Ethereum’s long-term value. However, short-term traders remain cautious due to the uncertain macro environment. Open interest in ETH futures has seen a decline, suggesting that many traders are waiting for confirmation before making big moves. This means that volatility could spike significantly once a clear direction is established.
Overall, Ethereum is at a critical juncture. The historical comparison to 2021 suggests that this could be the start of a major recovery, but whether or not history repeats itself depends largely on external factors like the Federal Reserve’s decision and broader market sentiment. If this support holds, ETH could be at the beginning of another strong bull cycle. If it fails, the bearish alternative could become the dominant narrative. The next few days will be crucial in determining which path Ethereum takes.

ETHUSD BUY?This market has been in a down trend.
RSI on daily time frame is showing oversold which could be a sign of exhaustion.
The market is currently testing the current Daily Area and based on Daily & 4HR TF, the market seems to be forming a possible reversal pattern which could lead to a possible reversal.
We could see BUYERS coming in strong should the current level hold.
Disclaimer:
Please be advised that the information presented on TradingView is solely intended for educational and informational purposes only.The analysis provided is based on my own view of the market. Please be reminded that you are solely responsible for the trading decisions on your account.
High-Risk Warning
Trading in foreign exchange on margin entails high risk and is not suitable for all investors. Past performance does not guarantee future results. In this case, the high degree of leverage can act both against you and in your favor

Ethereum Potential DownsidesHey Traders, in today's trading session we are monitoring ETHUSDT for a selling opportunity around 1929 zone, Ethereum is trading in a downtrend and currently is in a correction phase in which it is approaching the trend at 1929 support and resistance area.
Trade safe, Joe.

Recovery incomingEverybody sees more drops which is crash and collapse.. for me i see a recovery.
Another leg and back the support and dip inside 1860 key support zone.
Ethereum need to keep the bulls momentum and break way pass 2,050 area and 2,100 so the recovery is back healthy for the bulls to break the high. So now baby steps first and lets see how this plays out

Ethereum run is inevitable!While fear in CRYPTOCAP:ETH is at the same level as the FTX LUNA COVID19 crashes, momentum has given a local bottom signal during these times when fear is at its peak, and we are at the same level now!

ETH/USD – Bullish Breakout Trade Setup (4H Chart)ETH/USD – Bullish Breakout Trade Setup (4H Chart)
Ethereum is testing a key trendline resistance on the 4-hour chart. A breakout above this level could trigger a strong upside move.
Entry: Above 1,885 (after confirmation).
Take Profit: 2,596.
Stop Loss: 1,700.
Risk-Reward Ratio: High reward potential.
A successful breakout could lead to a bullish rally toward 2,596. Watch for volume confirmation before entering.

Ethereum Right now ethereum following down trade
As you can see the resistance shown on the chart
It will follow down until it break the resistance
The reason is the weekly candle, monthly, 3 months and 6 months, all this candle has new All Time low
Even if the market is positive and Bull run the ethereum fundamental data won't allow this token to push the price up
We have first to wait tomorrow on the new weekly candle and we supposed to keep the price not going down over the previous weekly candle then after 16 days on the monthly candle we have to do the same
If all upcoming weekly monthly 3 months and 6 months candles maintain to make new all-time high that's get the ethereum back on the track
It is normal to see ethereum on this price
I believe that they wanted to break all these candles down to lower the price and shake out holders to to go further up with no way this holders dump it at 4k like last two attempts we had

Ethereum (ETH/USD) Bearish Setup | Cup and Handle BreakdownEthereum (ETH/USD) Chart Overview:
Ethereum (ETH/USD) has formed a Cup and Handle pattern on the daily timeframe, but instead of breaking out bullish, price is showing signs of a bearish breakdown.
The handle formation has taken the shape of a rising wedge, a typical bearish continuation pattern.
Price has broken below the wedge support, confirming potential downside momentum.
Technical Analysis:
1. Cup and Handle Breakdown: A failed bullish continuation suggests that sellers have taken control.
2. Rising Wedge Pattern: The recent consolidation (handle) formed a rising wedge, which has now broken down.
3. Key Resistance Zone: The $2,869 level is acting as strong resistance, preventing further upside.
4. Breakout Confirmation: ETH/USD has broken below the handle support, indicating a continuation of the downtrend.
Trade Plan:
Short Entry: Below $2,505
Stop-Loss: Above $2,869 (invalidates the setup if price reverses)
Target: $1,700 (previous support and Fibonacci level)
Fundamental Outlook:
Ethereum has faced selling pressure amid broader crypto market uncertainty.
Macroeconomic factors like rising bond yields and regulatory concerns could add to the bearish sentiment.
If Bitcoin faces further downside, ETH could follow suit.
If ETH remains below the breakout zone, we anticipate further downside toward $1,700. However, a reclaim of $2,869 could invalidate this bearish bias.
Must Suport And Let me know your thoughts! Happy trading!

ETHUSD The Week Ahead 17th March ‘25The ETH/USD pair is exhibiting a bearish sentiment, reinforced by the ongoing downtrend. The key trading level to watch is at 2,220, which represents the current intraday swing high and the falling resistance trendline level.
In the short term, an oversold rally from current levels, followed by a bearish rejection at the 2,220 resistance, could lead to a downside move targeting support at 1,723, with further potential declines to 1,545 and 1,375 over a longer timeframe.
On the other hand, a confirmed breakout above the 2,220 resistance level and a daily close above that mark would invalidate the bearish outlook. This scenario could pave the way for a continuation of the rally, aiming to retest the 2,400 resistance, with a potential extension to 2,620.
Conclusion:
Currently, the ETH/USD sentiment remains bearish, with the 2,220 level acting as a pivotal resistance. Traders should watch for either a bearish rejection at this level or a breakout and daily close above it to determine the next directional move. Caution is advised until the price action confirms a clear break or rejection.
This communication is for informational purposes only and should not be viewed as any form of recommendation as to a particular course of action or as investment advice. It is not intended as an offer or solicitation for the purchase or sale of any financial instrument or as an official confirmation of any transaction. Opinions, estimates and assumptions expressed herein are made as of the date of this communication and are subject to change without notice. This communication has been prepared based upon information, including market prices, data and other information, believed to be reliable; however, Trade Nation does not warrant its completeness or accuracy. All market prices and market data contained in or attached to this communication are indicative and subject to change without notice.

Ethereum (ETH/USD) - Bearish Continuation Setup
📉 Market Structure:
The chart displays a strong downtrend with Ethereum trading inside a descending channel. The price recently broke below a key support level and is now consolidating within a range.
🔍 Key Levels:
Resistance Zone: $2,050
Current Price: $1,884
Support Zone: $1,690
Target: $1,438
📊 Trade Idea:
If price retests the support-turned-resistance around $1,930–$2,050 and rejects, a strong move to the downside is likely.
A confirmed break below the $1,690 support zone could trigger further bearish momentum toward the $1,438 target.
Traders may look for short positions upon a bearish rejection at resistance or a confirmed breakdown.
🚨 Confirmation & Risk Management:
Bearish Confirmation: Rejection from resistance or a breakdown of the range.
Invalidation: A sustained breakout above $2,050.
Risk Management: Stop-loss placement above resistance to mitigate risk.
This setup aligns with the prevailing bearish trend, favoring short opportunities unless a strong reversal occurs.

Ethereum Long Trade Idea – Target $2,135Ethereum (ETH) presents a potential long opportunity with a target of $2,135, supported by several fundamental and technical factors.
Fundamental Drivers for Upside:
1. Institutional Interest & Spot ETF Potential – Growing speculation around an Ethereum spot ETF approval in the U.S. could drive increased institutional adoption, similar to Bitcoin’s rally after ETF approvals.
2. On-Chain Activity & Network Upgrades – Ethereum’s on-chain metrics, including active addresses and staking deposits, remain strong. The upcoming Dencun upgrade aims to enhance scalability, reducing gas fees and making the network more efficient.
3. Macroeconomic Tailwinds – A potential shift in Federal Reserve monetary policy (rate cuts later in 2025) could weaken the U.S. dollar and push investors toward risk-on assets like ETH.
4. Correlation with Bitcoin & Crypto Market Sentiment – If Bitcoin continues its bullish trajectory, Ethereum is likely to follow due to its historical correlation.
Risk & Considerations:
• Regulatory Uncertainty – The SEC’s stance on Ethereum’s classification (security vs. commodity) could create volatility.
• Market Volatility – Crypto remains highly speculative, and ETH’s price action can be unpredictable.
• High Risk-Reward Ratio – While the target of $2,135 is achievable, this trade carries elevated risk, requiring disciplined risk management.
This is a high-risk, high-reward setup, and traders should adjust their position sizing accordingly.

This is gonna wake some people up!!!This is a possible break from the triangle that will set peoples' hair on fire. This is how money is potentially made. I'm short!

