ETHUSD.P trade ideas

Pullback Soon Ethereum is eager to onboard as many passengers as possible before the rocket takes off, but this won’t last long as there’s still room for a correction in the long term. We can reassess the trade later this year once targets are reached, ideally filling the gap on the volume profile. That’s where I plan to load up on alts.
Disclaimer: Not financial advice! 🚨 Do your own research. Markets are risky—trade at your own discretion. I’m just sharing ideas, not guarantees. 📉📈

This could be a bitter end for Ethereum or an opportunity !!!This could be a bitter end for Ethereum or an opportunity. If the triangle is broken from below, the price will drop to $1300.
Give me some energy !!
✨We spend hours finding potential opportunities and writing useful ideas, we would be happy if you support us.
Best regards CobraVanguard.💚
_ _ _ _ __ _ _ _ _ _ _ _ _ _ _ _ _ _ _ _ _ _ _ _ _ _ _ _ _ _ _ _
✅Thank you, and for more ideas, hit ❤️Like❤️ and 🌟Follow🌟!
⚠️Things can change...
The markets are always changing and even with all these signals, the market changes tend to be strong and fast!!

ETH plan📈 Bullish Divergence on the Daily tf, combined with the expected cold CPI today, could give a good impulse (be careful with leverage today!), which I hope will give us a confirmed trend reversal (CHoCH) on Ethereum. 🟢
After that, we just need to wait for a good entry point in the discount zone area, and potentially a 5RR in our pocket. 👀
Plan the trade. Trade the plan.

Instability, BTC’s Downtrend & ETH at a Critical Level!The crypto market has been highly unstable over the past few weeks, largely due to the Federal Reserve’s stance on monetary policy. With no signs of quantitative easing, the market has reacted negatively, triggering a broader downtrend—especially for Bitcoin.
On Sunday, we witnessed a dramatic price surge, with BTC skyrocketing from $84K to $94K, only to see all gains wiped out within a single day. This price action is eerily similar to the 2019 “China Pump,” when BTC spiked from $7K to $10K before retracing completely within days. Such volatility suggests that sentiment remains fragile, and sellers continue to dominate.
Ethereum (ETH): A Sign of Weakness?
ETH isn’t looking strong either. It’s currently hovering around the $2,100 level, sitting right on a critical support zone. As I’ve highlighted in my chart, ETH has already broken below its support trendline—a bearish signal that suggests further downside risk. If this key support level fails to hold, we could see ETH drop to around $1,500 in the coming weeks.
Implications for the Altcoin Market
If ETH loses its support zone, it could trigger a major sell-off across the entire altcoin market. Historically, ETH acts as a leading indicator for altcoins, and a breakdown here could push Bitcoin dominance up to 66%-70% before altcoins find a bottom. This means we could be in for another phase of altcoin underperformance while BTC consolidates.
Final Thoughts: Watch ETH Closely!
Given the current market structure, my suggestion is to monitor ETH closely at these levels. If it fails to hold, expect a significant downward move in the altcoins market. Bitcoin dominance rising would confirm that altcoins are in for a rough period ahead. Stay cautious and trade accordingly!
Stock Market Struggles Add to Bearish Sentiment
It’s not just crypto feeling the pressure—the stock market isn’t looking good either. Both the S&P 500 and NVIDIA are down significantly today, adding to the overall negative sentiment. When traditional markets struggle, risk assets like crypto tend to follow suit.
That said, I’m expecting one final leg down before we see a shift. Once the Federal Reserve signals quantitative easing (QE), we can start anticipating a return to bullish momentum across both stocks and crypto. Until then, caution is key!

ethereum eth #ethethereum showing good dumping as small time frame demand broken focus on rise move for fresh entry.

EthereumETHUSD ( Ethereum / U.S Dollar )
Key Points :
1. Point of Interest
2. RSI - Divergence
3. S / R Level
4. Rising Wedge
5. Elliot Waves
ETHEREUM Stock Chart Fibonacci Analysis 031125Trading Idea
1) Find a FIBO slingshot
2) Check FIBO 61.80% level
3) Entry Point > 1800/61.80%
Chart time frame: D
A) 15 min(1W-3M)
B) 1 hr(3M-6M)
C) 4 hr(6M-1year)
D) 1 day(1-3years)
Stock progress: C
A) Keep rising over 61.80% resistance
B) 61.80% resistance
C) 61.80% support
D) Hit the bottom
E) Hit the top
Stocks rise as they rise from support and fall from resistance. Our goal is to find a low support point and enter. It can be referred to as buying at the pullback point. The pullback point can be found with a Fibonacci extension of 61.80%. This is a step to find entry level. 1) Find a triangle (Fibonacci Speed Fan Line) that connects the high (resistance) and low (support) points of the stock in progress, where it is continuously expressed as a Slingshot, 2) and create a Fibonacci extension level for the first rising wave from the start point of slingshot pattern.
When the current price goes over 61.80% level , that can be a good entry point, especially if the SMA 100 and 200 curves are gathered together at 61.80%, it is a very good entry point.
As a great help, tradingview provides these Fibonacci speed fan lines and extension levels with ease. So if you use the Fibonacci fan line, the extension level, and the SMA 100/200 curve well, you can find an entry point for the stock market. At least you have to enter at this low point to avoid trading failure, and if you are skilled at entering this low point, with fibonacci6180 technique, your reading skill to chart will be greatly improved.
If you want to do day trading, please set the time frame to 5 minutes or 15 minutes, and you will see many of the low point of rising stocks.
If want to prefer long term range trading, you can set the time frame to 1 hr or 1 day.

Ethereum $ETH Accumulation Analysis
🔸 Key Support Zone at $1,500 - $1,900:
Ethereum is currently testing a crucial support zone. Historically, this range has provided strong demand, making it an ideal area for long-term accumulation.
🔸 Upside Target: $3,500 - $4,500
If ETH holds this zone and reverses, a breakout above $2,200 could trigger a strong bullish move towards $3,500 and beyond.
🔸 Risk Level at $1,400:
A clean breakdown below $1,400 would invalidate the bullish setup and could lead to further downside.
🔸 Action Plan:
Start accumulating ETH between $1,900 - $1,500 using a DCA strategy.
Wait for a breakout above $2,200 for confirmation of strength.
A dip below $1,400 should prompt risk reassessment.
This setup offers a high-reward potential, but patience and risk management are key.

PROBABLY BEARISH FOR NEXT WEEKSThat little bop will happen soon
Down bearish unless rsi changes
What do you think?

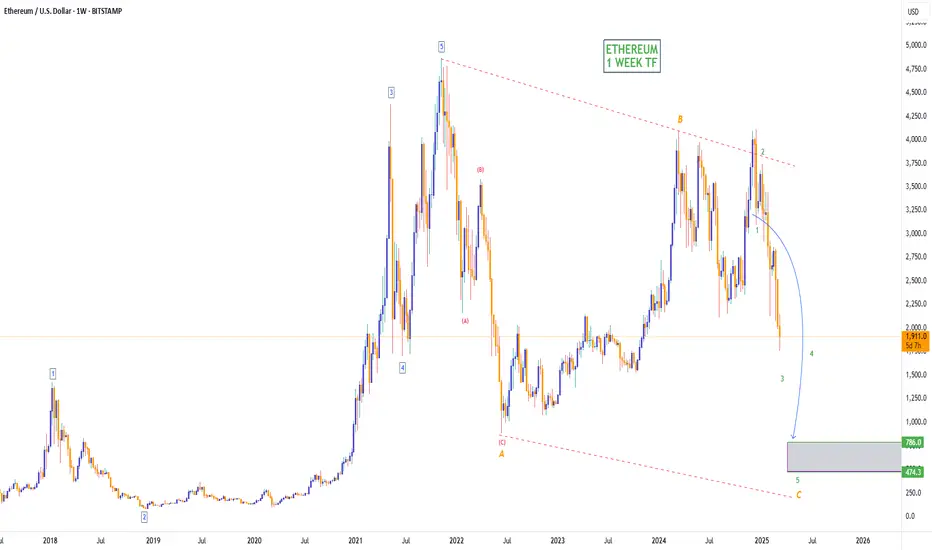
ETHEREUM CRASH TO $786! (UPDATE)Remember my Ethereum sell prediction from September 2024? Despite it pushing a little higher, price has remained within the trendlines & bearish channel, keeping its trend in a 'downtrend'.
We're still within a 3 Sub-Wave (A,B,C) corrective channel, with the current bearish move down being Wave C. Wave C target still remains around $786🩸
ETH - kiss of death repeating pattern confirmed - now what?Fact: Every time in history that we have closed a breakthrough candle on the monthly chart through the 21 SMA on ETHUSD, we have entered a bear market.
Fact: We did just that with February's monthly candle.
The same exact pattern has repeated 3x already.
Will this be any different this time?

ETH Bullish in the short term, bearish in the medium termThe five upward steps were completed some time ago and we entered three downward steps. The first downward step is over and we must wait for the price to grow to 2730, which is a heavy resistance, and then enter the third step, which is a decline to 1055, which is a strong support.

ETH(based on NEo wave)This supercycle is a nice nature triangle which E wave is ending and its look like a diamon diametrical.
so I will update it for the confirmation, I think ALTseason is so close and we can see that happening soon but this season take about 400 to 450 days and after that there is a huge CRASH!

Breaking: Ethereum Dips 9% Today losing the $2k Price LevelEthereum today saw a noteworthy downtick with the asset dipping below the $2000 pivot zone. currently trading around the $1900 - $1700 price zones.
Ethereum is currently oversold as depicted by the Relative Strength Index (RSI) at 36. The 1-month low is acting as support point for Ethereum. Should selling pressure continue, CRYPTOCAP:ETH might tanked to $1000- 1400 price levels.
However, in the case of a price reversal, a break above the 65% Fibonacci retracement level could placed CRYPTOCAP:ETH on the cusp of a bullish spree.
Despite the bloodbath facing Ethereum albeit the general crypto landscape facing same, data from DefiLlama hints at a growing Defi landscape in the Ethereum blockchain with about $45.43 billion locked in Total Value Lock (TVL) and the volume growing in tandem with the TVL locked.
Presently up 2% trading at $1905 price point all eyes are set on the major pivots we mentioned above.

Bullish ETHUSD Long (long term) PennantBack in 2017 during the bull run we saw ETH break out of the Pennant to form a new ATH after rising ~300% from the point of break out of the pennant.
This is not a financial advice, but my view is that all market conditions allowing (since ETH isn't likely to soar up alone when BTC and other major top 10 coins are falling), that Eth will do a similar 300% rise to $12,000~$13,000 USD in the next coming years.
This was formulated based on Weekly chart pattern so this is going to be far out in the future but I just wanted to share my thoughts and call it out to see if I'm right or wrong in the future.
TP $12,000 (I would personally would break down TPs into 2-4 points, taking profit each levels, most of the time based on fibonacci retracement levels)
SL $1800
----
P.S. to my future self:
RSI, MACD, Volume not carefully taken into account.
You think that the price would reach around 2026 Sep.
You think we're at the spring of Wyckoff accumulation/Distribution cycle.
You are also weary about the little break out to the bottom which might be already signaling a bearish breakout, you are also worried about the lack of volume in the past year during these price action which also indicates a bearish, but you decided to set a stop loss and see it as a mega bullish trend on its way and banking on 2017 pattern to repeat in the coming years, trumping the bearish sentiment

Ethereum at Key Support: Will it bounce to 2,800$?COINBASE:ETHUSD price is moving inside a clear ascending channel , with the upper boundary acting as long-term resistance and the lower boundary providing dynamic support. After a steady climb, the price started showing weakness, confirmed by a head and shoulders pattern, a common sign that the trend might reverse. This led to a strong drop, bringing the price down to a key support zone around $2,000.
This support area is important because it meets with a major trendline, making it a likely spot where buyers could step in. The volume profile also shows a lot of activity in this zone, meaning traders have been interested in these levels before. If the price holds above this support, there’s a good chance it could bounce towards $2,800, which lines up with a previous resistance.
A breakdown below the trendline shifts the bias bearish toward 1,414. For now, as long as Ethereum stays above the support zone, a recovery toward $2,800 is on the table. But if it falls below, the bearish trend is likely to continue.
Just my take on support and resistance zones, not financial advice. Always confirm your setups and trade with solid risk management.

#ETH this is my last attempt to aim for 4k again on #ETH, if we start to have HTF closings below my zone i will wait for it again at 3 digits
RSI isn't looking pretty on HTF so yeah better now or never

Ethereum will move to the upside1. Current Price and Context
The current price of ETHUSD is $1,848.22, as indicated by the red label at the bottom right of the chart.
This price represents a significant decline from earlier highs, suggesting a corrective phase following a prior uptrend.
2. Price Movement and Trend
The chart shows a sharp upward movement starting in early 2024, with the price reaching a high near $4,000 (orange horizontal line).
After this peak, the price entered a correction phase, dropping steadily. The downward movement is marked by a descending triangle pattern, a bearish continuation pattern characterized by lower highs and a flat or slightly declining lower trendline.
The upper trendline of the descending triangle slopes downward, while the lower support level was initially around $2,100 (orange horizontal line labeled "Correction").
3. Breakdown and Support Levels
The price has recently broken below the $2,100 support level, which could indicate a continuation of the bearish trend or a potential exhaustion point.
The current price of $1,848.22 is near a significant low, with the chart suggesting this as an "Opportunity to go for long" (yellow annotation). This implies that some traders might see this as a potential reversal point to enter a long position, anticipating an upward move.
4. Potential Targets and Resistance
The chart projects a potential upside target near the previous high of $4,000 if the price reverses and breaks out of the descending triangle pattern.
The vertical orange line at $4,071 suggests a psychological or technical resistance level that the price approached earlier in the trend.
5. Technical Observations
Descending Triangle: This pattern often signals a continuation of a downtrend unless a strong bullish reversal occurs. The breakdown below $2,100 supports the bearish case, but the current low at $1,848.22 could act as a support zone if buying interest emerges.
Volume (not shown): Without volume data, it’s hard to confirm the strength of the breakdown or potential reversal. Typically, a breakout with high volume would carry more significance.
Timeframe: The 12-hour chart suggests this is a medium-term analysis, suitable for swing traders looking for opportunities over days or weeks.
6. Possible Scenarios
Bullish Scenario: If the price holds above $1,848.22 and starts to recover, it could test the $2,100 level again. A break above $2,100 with strong momentum might signal a return to the $4,000 range, aligning with the "Opportunity to go for long" annotation.
Bearish Scenario: If the price fails to hold $1,848.22 and continues to decline, it could test lower support levels (e.g., $1,500 or below), indicating further correction.

ETHEREUM CRASH TO $786! (UPDATE)Remember my ETH short bias from last September? Despite it pushing up a little, price has remained within the trendlines & bearish channel, keeping its main trend in a 'downtrend'.
We are still within a 3 Sub-Wave (A,B,C) corrective channel, with the current bearish move down being Wave C. Wave C target still remains around $786🩸

Short Trade at Ethereum executed Strong signal received on ETH which shows a Profit Factor of 4.00 in Short Trading at the 15min timeframe. The trade was open for 45min and the Exit was placed at a very nice spot.
Would you like to receive such sort of signals in realtime? Tell me in the comments and follow for more!

ETH Weekend Analysis. Low Risk TradeLooking for a candle close on the 4HR above the last highest wick.
Should guide us straight to the next purple level above around the time of the Spot ETF release.

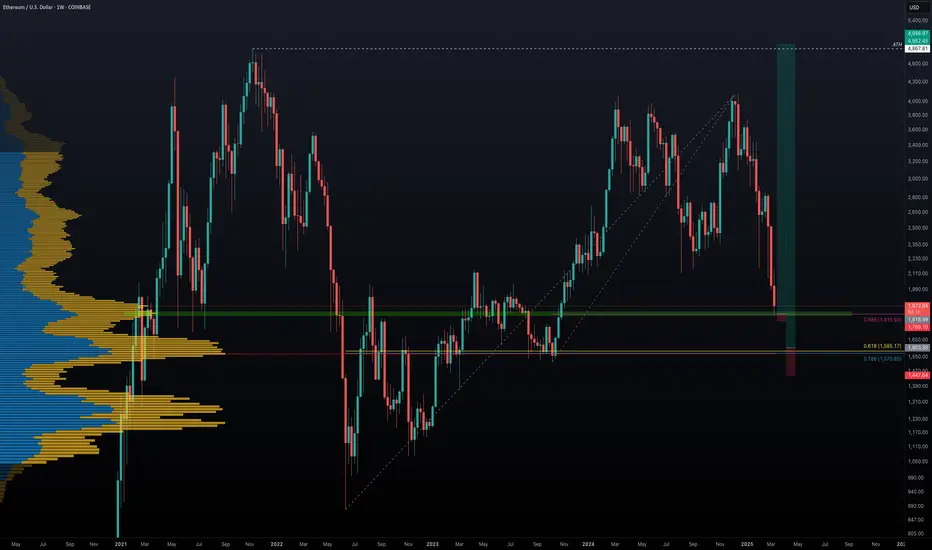
Ethereum's Potential Bottom: Could $5000 Be Next?Ethereum has experienced a significant 56% drop over the last 84 days. Has ETH found its bottom, or is more downside ahead? Let's break it down.
🔹 Fibonacci Retracement from October Low (2023) to December High (2024)
Starting with the Fibonacci retracement from the low of $1520.85 on 12th October 2023 to the high of $4109 on 16th December 2024, ETH recently hit the 0.886 Fib retracement at $1815.9 and saw a bounce. This area aligns with the Point of Control (POC) from previous price action, a potential signal that this could be a major support zone.
However, the real question is whether this is the final bottom, or if ETH will retest lower levels.
🔹 Further Fibonacci Retracement Analysis
Next, we take a larger Fibonacci retracement, from the low of $879.8 on 18th June 2022 to the high of $4109. The 0.786 Fib retracement at $1570.85 appears to be a critical support zone, as it also coincides with the POC in the volume profile of the entire market structure. This indicates that the $1570-$1600 region is a significant area of interest for buyers to step in.
🔹 Log Scale Fibonacci Confluence
To further strengthen this analysis, applying the same Fibonacci retracement on a log scale shows the 0.618 Fib retracement at $1585.17, very close to the POC and 0.786 Fib level, reinforcing this region as a major support zone.
🔹 High-Probability Long Setup
If ETH revisits the $1570-$1600 zone, this forms an ideal high-probability long setup with excellent risk/reward potential. A potential R:R ratio of more than 20:1 could materialise if this setup plays out and price targets $5000 as a take-profit level. The stop loss placement will determine the exact risk-to-reward, but the reward could be massive if this level holds.
💬 What are your thoughts? Will Ethereum find its bottom around these key levels? Excited to see how this develops! 🚀