Global Market Overview. Part 4.1: ETHEthereum: Fell. Miscalculated. Still Believe.
(Previous post:https://www.tradingview.com/chart/BTCUSD/ecmMaAdq-Global-Market-Overview-Part-4-BITCOIN/)
Let me get straight to the point: I lost over $300,000 during the last Ethereum rally. That’s a fact. And I’m not alone.
But here’s what truly matters: I still consider Ethereum one of the most fundamentally strong assets in the entire crypto market.
And I’ll explain why this drop isn’t a collapse into the abyss — but a temporary breakdown in price mechanics, driven not by fundamentals, but by greed and speculation.
What went wrong?
At first glance, the market behavior made no sense.
While BTC, Solana, XRP — and even meme coins — were being aggressively bought up, Ethereum just... froze.
No breakout. No test of previous highs. Not even a real attempt.
Which is strange, considering:
Ethereum has become a deflationary asset — more ETH is being burned than issued
ETH ETFs have attracted hundreds of millions of dollars
Developers are consistently improving the network and reducing fees
It remains the backbone of both the DeFi and NFT ecosystems
And yet — the price stood still. And then it fell.
Why? Because we are to blame.
Let’s be honest. I made a mistake. Just like millions of others.
Instead of holding ETH on spot, I went long with leverage on futures.
I thought I’d amplify my volume. Boost my profits.
Instead — I amplified my liquidation.
That’s exactly what happened to the market:
ETH futures volume exceeded spot volume
Open interest in long positions skyrocketed
Market makers saw the imbalance — and began systematically flushing out over-leveraged positions
The price didn’t fall because there’s something wrong with Ethereum.
It fell because the market became too one-sided.
Greed became vulnerability — and the market makers took full advantage.
And then came tariffs.
As if the futures flush wasn’t enough, the market got hit with more bad news:
Trump’s administration escalated a new trade war.
Stock indices dropped. The dollar strengthened.
Crypto got slammed again — this time not technically, but macroeconomically.
Now Ethereum is sitting far below its highs.
Disappointment in the eyes of millions.
And yes — heavy losses, including mine.
Will there be a reversal?
Yes. Hell yes.
I don’t know exactly when, but I’m absolutely certain that it will come.
Ethereum will recover.
Why?
There’s fundamental demand. Exchanges are running low. Whales are accumulating and transferring ETH to cold storage.
Technologically, it’s stronger than its competitors. No other L1 or L2 has the developer base or ecosystem Ethereum commands.
The market will get a tailwind. Any de-escalation in the trade war could reignite the entire crypto space.
It’s undervalued. ETH at $2,000 is a floor. In a normal market phase, it’ll trade much higher — significantly.
This isn’t a revenge play. It’s analysis.
I’m not writing this to justify myself.
I’m writing to say this: Ethereum is not dead.
It’s exhausted. Temporarily.
I understand those who sold. It’s human.
But I’m staying. Because unlike hype-driven altcoins, Ethereum is infrastructure.
You can’t replace it.
You can’t bypass it.
You can only ignore it — and regret it later.
Bottom line
Ethereum doesn’t have to move in sync with Bitcoin.
It has its own path.
But that path is not downward.
Right now, it just happens to go through the pain of futures liquidations and media noise.
As soon as Trump exhales, as soon as the rhetoric shifts — the market will see ETH at $2,500 and beyond.
And this growth won’t be speculative — it’ll be based on fundamentals.
Yes, I lost $300K.
But I haven’t lost faith in the asset.
And I’m not going anywhere.
Because Ethereum doesn’t end with this drawdown.
It’s just getting ready for its next phase.
ETHUSD.P trade ideas

(ETH) ethereum "rays - month by year pattern(s)"I drew lines between each year connecting each month one year at a time using rays so that the lines would continue on through the chart. I was hoping this would give me some indication of a pattern or view on the chart that would reveal something ideal to see into the future.
...I do see one tiny pattern.
At the beginning of 2022 the previous early months rays were ascending but by the second quarter the rays were descending. That is the same thing that happened this year. The hopeful becomes the hopeless.
Are we in for a horrible Ethereum year?


Be careful with ETH !!!now is the time for ETH to rise again to 1900 . STRONG SUPPORT 1530 .
Give me some energy !!
✨We spend hours finding potential opportunities and writing useful ideas, we would be happy if you support us.
Best regards CobraVanguard.💚
_ _ _ _ __ _ _ _ _ _ _ _ _ _ _ _ _ _ _ _ _ _ _ _ _ _ _ _ _ _ _ _
✅Thank you, and for more ideas, hit ❤️Like❤️ and 🌟Follow🌟!
⚠️Things can change...
The markets are always changing and even with all these signals, the market changes tend to be strong and fast!!

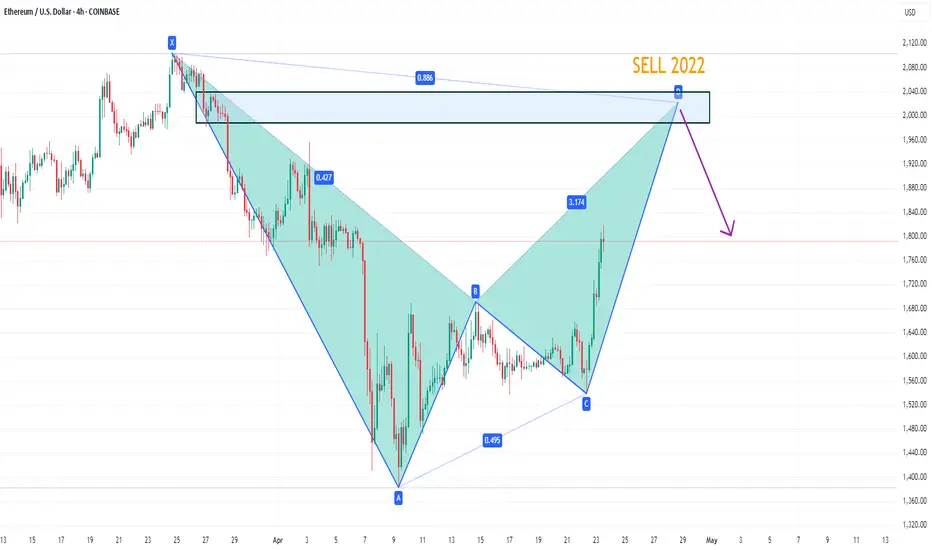
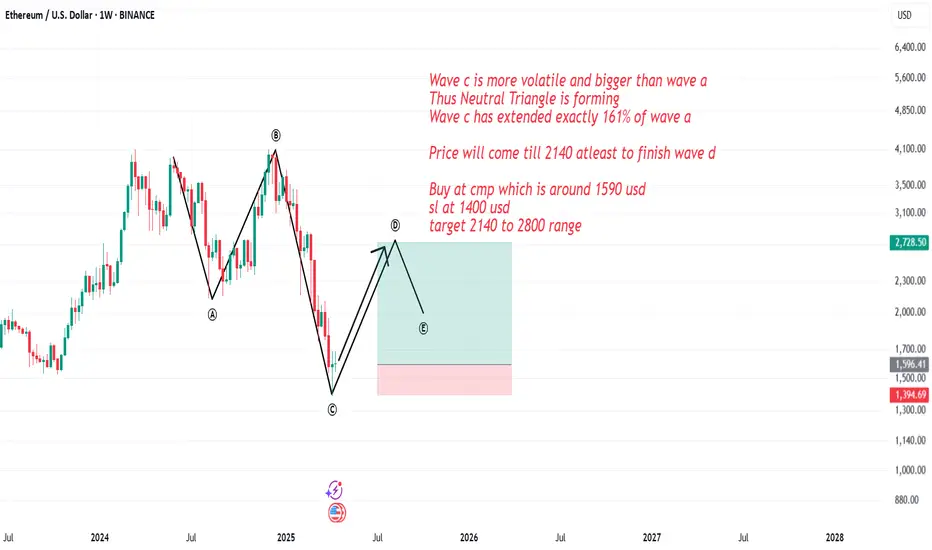
Buy Ethusd for 1:5 risk reward Etherium will be bullish for 2 to 3 months now till it reach 2140 usd range
Wave c is more volatile and bigger than wave a
Thus Neutral Triangle is forming
Wave c has extended exactly 161% of wave a
Price will come till 2140 atleast to finish wave d
Buy at cmp which is around 1590 usd
sl at 1400 usd
target 2140 to 2800 range
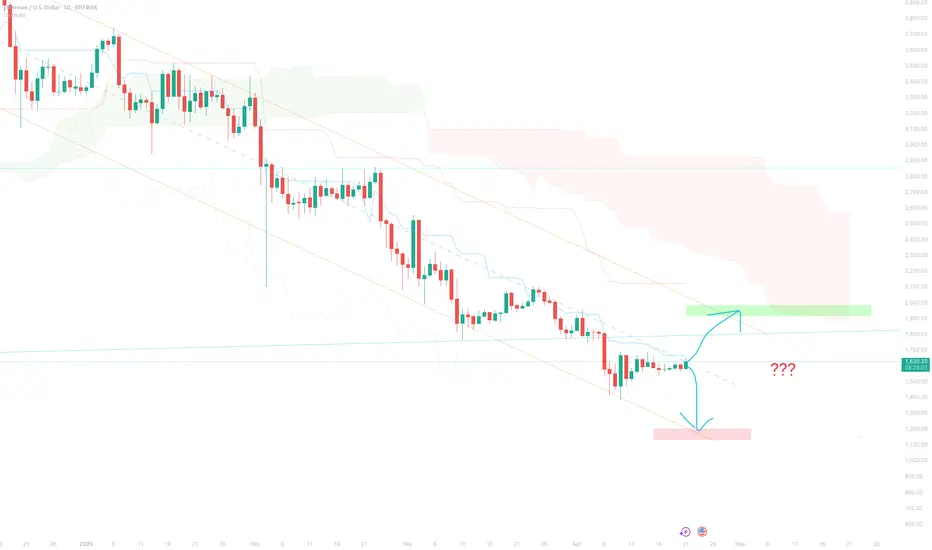
Could the price reverse from here?Ethereum (ETH/USD) is rising towards the pivot which is an overlap resistance and could reverse to the 1st support which is a pullback support.
Pivot: 1.851.36
1st Support: 1,683.61
1st Resistance: 1,945.78
Risk Warning:
Trading Forex and CFDs carries a high level of risk to your capital and you should only trade with money you can afford to lose. Trading Forex and CFDs may not be suitable for all investors, so please ensure that you fully understand the risks involved and seek independent advice if necessary.
Disclaimer:
The above opinions given constitute general market commentary, and do not constitute the opinion or advice of IC Markets or any form of personal or investment advice.
Any opinions, news, research, analyses, prices, other information, or links to third-party sites contained on this website are provided on an "as-is" basis, are intended only to be informative, is not an advice nor a recommendation, nor research, or a record of our trading prices, or an offer of, or solicitation for a transaction in any financial instrument and thus should not be treated as such. The information provided does not involve any specific investment objectives, financial situation and needs of any specific person who may receive it. Please be aware, that past performance is not a reliable indicator of future performance and/or results. Past Performance or Forward-looking scenarios based upon the reasonable beliefs of the third-party provider are not a guarantee of future performance. Actual results may differ materially from those anticipated in forward-looking or past performance statements. IC Markets makes no representation or warranty and assumes no liability as to the accuracy or completeness of the information provided, nor any loss arising from any investment based on a recommendation, forecast or any information supplied by any third-party.

Bearish drop?Ethereum (ETH/USD) is reacting off the pivot and could drop to the 1st support.
Pivot: 1,570.37
1st Support: 1,437.45
1st Resistance: 1,685.57
Risk Warning:
Trading Forex and CFDs carries a high level of risk to your capital and you should only trade with money you can afford to lose. Trading Forex and CFDs may not be suitable for all investors, so please ensure that you fully understand the risks involved and seek independent advice if necessary.
Disclaimer:
The above opinions given constitute general market commentary, and do not constitute the opinion or advice of IC Markets or any form of personal or investment advice.
Any opinions, news, research, analyses, prices, other information, or links to third-party sites contained on this website are provided on an "as-is" basis, are intended only to be informative, is not an advice nor a recommendation, nor research, or a record of our trading prices, or an offer of, or solicitation for a transaction in any financial instrument and thus should not be treated as such. The information provided does not involve any specific investment objectives, financial situation and needs of any specific person who may receive it. Please be aware, that past performance is not a reliable indicator of future performance and/or results. Past Performance or Forward-looking scenarios based upon the reasonable beliefs of the third-party provider are not a guarantee of future performance. Actual results may differ materially from those anticipated in forward-looking or past performance statements. IC Markets makes no representation or warranty and assumes no liability as to the accuracy or completeness of the information provided, nor any loss arising from any investment based on a recommendation, forecast or any information supplied by any third-party.

Ethereum: Falling Wedge, Double Bottom and MACD Divergence AlignA powerful bullish setup may be forming on ETH — but confirmation is everything. Watch how the falling wedge, double bottom, and MACD divergence align for one of the cleanest potential long opportunities.
Ethereum is now shaping a potentially powerful reversal structure, combining a falling wedge, a possible double bottom, and bullish MACD divergence. The price has been moving inside a well-defined downward channel since the December highs, gradually compressing within this wedge — and from my experience in both trading and teaching, Ethereum loves falling wedges. This pattern has historically worked well for ETH in previous cycles.
But it’s not enough to simply break out of the wedge. For the double bottom to fully confirm, price must also hold above the key ~$2,100 zone. Only then will all three factors — the wedge breakout, the double bottom confirmation, and the MACD bullish divergence — work together, aligning like a perfect constellation. I often say to my students: these moments are the trader’s “planetary alignment” — the rare setup where technicals support each other instead of contradicting.
If ETH manages to clear and retest this zone successfully, the structure opens the way toward the next targets at $2,350, $2,555, and potentially $2,800, as marked on the chart. These levels reflect previous accumulation zones and key reaction areas.
Another important factor is the correlation across markets. Bitcoin is also forming a double bottom, and we’re seeing a similar structure on the S&P 500. This potential synchronized movement between crypto and equities makes the setup even more interesting. Such alignment across assets doesn’t happen often — and when it does, it’s worth paying attention.
The key now is not to jump the gun. A clean breakout without confirmation often leads to fake moves. What I’m watching closely is whether ETH can close and hold above $2,100. Only then this setup becomes truly valid, offering an attractive entry point with a well-defined risk.
In my opinion, this is one of the most constructive technical scenarios we’ve seen on Ethereum in the past months. If the market confirms — the long opportunity here may come close to textbook perfection.

ETH Technical Analysis on 18.042025📉 ETH/USD Technical Analysis (18.04.2025) – Key Reversal or Further Drop?
🔍 Current Situation:
ETH is in a downtrend but showing signs of a potential reversal after testing a critical resistance level (Arrow #4). The price action here will determine the next major move.
✅ Bullish Reversal Scenario:
1. Break & Retest: If ETH breaks back above Arrow #3, consider a buy entry with confirmation.
2. Targets:
- First TP at Arrow #3a (minor resistance).
- Break above Arrow #2 and Arrow #1 would confirm a full trend reversal, opening targets higher.
3. Confirmation: Sustained closes above Arrow #2 (ideally with volume) would signal strength.
⚠️ Bearish Continuation Scenario:
- If ETH fails to hold Arrow #4, expect another leg down.
- Next major support at Arrow #5 (prepare for potential shorts or long entries there).
📊 Key Levels to Watch:
- Resistance: Arrow #3 → Arrow #2 → Arrow #1 (break these for reversal confirmation).
- Support: Arrow #4 (hold or break?) → Arrow #5 (next downside target).
🎯 Trading Plan:
- Longs: Only on a clean break/hold above Arrow #3, targeting 3a initially.
- Shorts: If Arrow #4 breaks, ride momentum to Arrow #5.
- Risk Management: Stop-loss below Arrow #4 for longs, or above Arrow #3 for shorts.
💡 Final Thought: Patience is key—wait for confirmation at these levels before committing. The trend is still bearish until Arrow #1 breaks!

Weekly plan for EthereumMarked the important levels in this video for this week and considered a few scenarios of price performance
Locally, it is important to see support from the $1,600 level
Write a comment with your coins & hit the like button, and I will make an analysis for you
The author's opinion may differ from yours,
Consider your risks.
Wish you successful trades! MURA

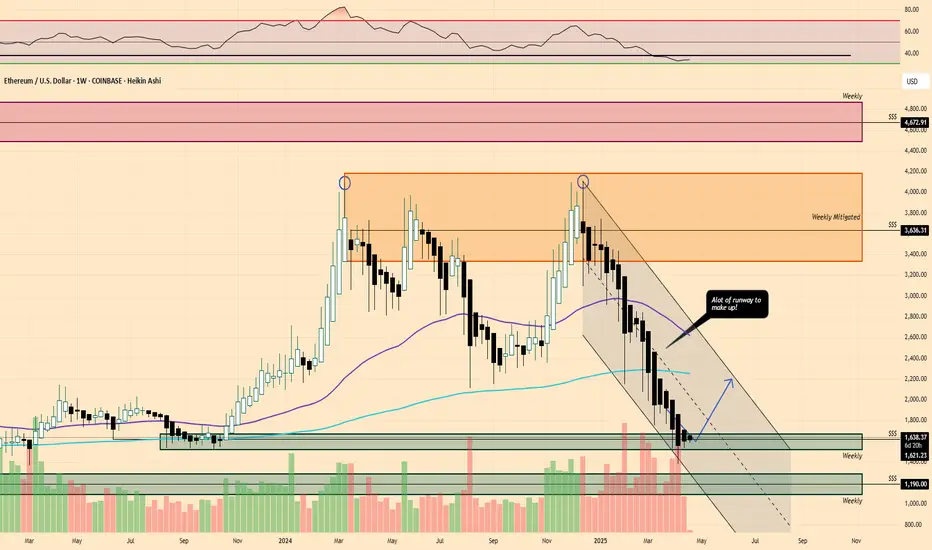
$ETH Next Move?Despite the FUD around Ethereum, I am focused on the charts and what they tell me.
I look at the downside that has brought us in this Weekly buying area. That downside was a clear move and looks great for a nice run back up.
I would still like to see a green candle present on this Weekly close to signify buyers but I think things are brewing for CRYPTOCAP:ETH

What's Next for ETH $1,200 or $2,000?If we can confidently break through the Middle Line of the downward Trend, then we go to $2k.
In general, the Fundamental is on the side of Ether.
The Main Factor Wall Street launches ETH-ETF Staking with a yield of 3-5% per annum.
This Feature Makes Ether Stand Out from Other Assets.


ETHUSD Technical Outlook (READ CAPTION)Hello Traders Look At my Given Chart And Share Your Ideas About it
As of April 17, 2025, Ethereum (ETH) is trading at approximately $1,581.14, reflecting a slight decline of 0.82% from the previous close.
Price Levels:
Current Price: Approximately $1,573.69
Support Levels: $1,5.42, $1,539.00, and $1,530.21
Resistance Levels: $1,642.30, $1,645.00, and $1,650.00 .


ETH Will Flip Bitcoin – Sooner Than You ThinkEveryone’s watching ETFs and halvings — but here’s what they’re not seeing:
Ethereum isn’t just a currency.
It’s digital infrastructure — powering AI, tokenized real estate, RWAs, and decentralized identity.
The next wave of global finance will run on Ethereum.
📈 My prediction:
By Q1 2026, ETH will flip BTC in market cap.
Not hype — mathematics + macro + mass adoption.
🧠 Smart money is already rotating.
Are you paying attention?
⏳ Don't say "nobody warned you."


Ethereum H4 | Falling toward a pullback supportEthereum (ETH/USD) is falling towards a pullback support and could potentially bounce off this level to climb higher.
Buy entry is at 1,674.75 which is a pullback support that aligns close to the 38.2% Fibonacci retracement.
Stop loss is at 1,520.00 which is a level that lies underneath a multi-swing-low support and the 61.8% Fibonacci retracement.
Take profit is at 1,913.15 which is a swing-high resistance.
High Risk Investment Warning
Trading Forex/CFDs on margin carries a high level of risk and may not be suitable for all investors. Leverage can work against you.
Stratos Markets Limited (tradu.com):
CFDs are complex instruments and come with a high risk of losing money rapidly due to leverage. 63% of retail investor accounts lose money when trading CFDs with this provider. You should consider whether you understand how CFDs work and whether you can afford to take the high risk of losing your money.
Stratos Europe Ltd (tradu.com):
CFDs are complex instruments and come with a high risk of losing money rapidly due to leverage. 63% of retail investor accounts lose money when trading CFDs with this provider. You should consider whether you understand how CFDs work and whether you can afford to take the high risk of losing your money.
Stratos Global LLC (tradu.com):
Losses can exceed deposits.
Please be advised that the information presented on TradingView is provided to Tradu (‘Company’, ‘we’) by a third-party provider (‘TFA Global Pte Ltd’). Please be reminded that you are solely responsible for the trading decisions on your account. There is a very high degree of risk involved in trading. Any information and/or content is intended entirely for research, educational and informational purposes only and does not constitute investment or consultation advice or investment strategy. The information is not tailored to the investment needs of any specific person and therefore does not involve a consideration of any of the investment objectives, financial situation or needs of any viewer that may receive it. Kindly also note that past performance is not a reliable indicator of future results. Actual results may differ materially from those anticipated in forward-looking or past performance statements. We assume no liability as to the accuracy or completeness of any of the information and/or content provided herein and the Company cannot be held responsible for any omission, mistake nor for any loss or damage including without limitation to any loss of profit which may arise from reliance on any information supplied by TFA Global Pte Ltd.
The speaker(s) is neither an employee, agent nor representative of Tradu and is therefore acting independently. The opinions given are their own, constitute general market commentary, and do not constitute the opinion or advice of Tradu or any form of personal or investment advice. Tradu neither endorses nor guarantees offerings of third-party speakers, nor is Tradu responsible for the content, veracity or opinions of third-party speakers, presenters or participants.