Resistance line from 2020As you can see from this simple monthly chart, we are in a symmetrical wedge and at the resistance line dating back to early 2020. I would say it's far more likely we trend up from here on the macro.
ETHUSD.P trade ideas

Bullish Divergence on the dailyI would also say that there is a bullish divergence happening on the daily, which further indicates likelihood of upward momentum.

ETH bullish RSI divergenceA bullish RSI divergence has formed on the daily timeframe, supporting the weekly trendline.
Are we going up from here ?

ETHEREUM BULLISH BIAS|LONG|
✅ETHEREUM fell again to retest the support of 1760$
But it is a strong key level
So I think that there is a high chance
That we will see a further bullish
Move up given that we are already
Seeing a bullish move up
LONG🚀
✅Like and subscribe to never miss a new idea!✅
Disclosure: I am part of Trade Nation's Influencer program and receive a monthly fee for using their TradingView charts in my analysis.

ETH Ready for PUMP or what ?Currently, ETH is forming an ascending triangle, indicating a potential price increase. It is anticipated that the price could rise, aligning with the projected price movement (AB=CD).
However, it is crucial to wait for the triangle to break before taking any action.
Give me some energy !!
✨We spend hours finding potential opportunities and writing useful ideas, we would be happy if you support us.
Best regards CobraVanguard.💚
_ _ _ _ __ _ _ _ _ _ _ _ _ _ _ _ _ _ _ _ _ _ _ _ _ _ _ _ _ _ _ _
✅Thank you, and for more ideas, hit ❤️Like❤️ and 🌟Follow🌟!
⚠️Things can change...
The markets are always changing and even with all these signals, the market changes tend to be strong and fast!!

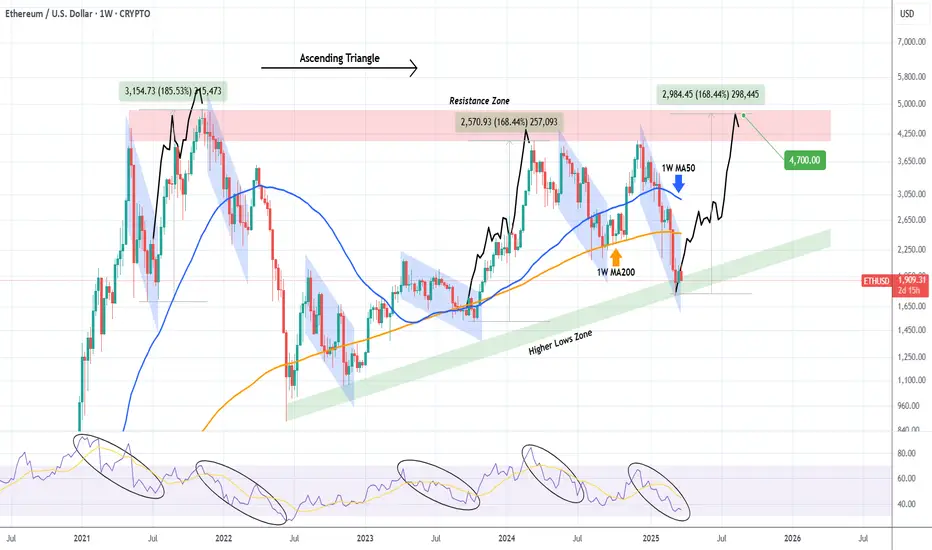
ETHEREUM Ascending Triangle bottomed and is targeting $4700.Ethereum (ETHUSD) hit 2 weeks ago the bottom (Higher Lows Zone) of its 4-year Ascending Triangle pattern, following the recent 3-month correction. That correction has technically been the pattern's Bearish Leg and during those 4 years we've had another 5 similar to this, all with the exception of one, producing a Higher High.
This is actually more similar to the October 09 2023 and June 21 2021 bottoms, so at worst we should get a +168.44% rally from here that will interestingly enough test the Triangle's top (Resistance Zone) a $4700.
-------------------------------------------------------------------------------
** Please LIKE 👍, FOLLOW ✅, SHARE 🙌 and COMMENT ✍ if you enjoy this idea! Also share your ideas and charts in the comments section below! This is best way to keep it relevant, support us, keep the content here free and allow the idea to reach as many people as possible. **
-------------------------------------------------------------------------------
💸💸💸💸💸💸
👇 👇 👇 👇 👇 👇
$ETH - Mean reversionCRYPTOCAP:ETH 8 year log-scaled channel, giving 1 s.d and 2 s.d deviations. Around 1600, we are approaching key levels at 1 s.d. below mean.
With institutions loading up, this could be a good spot to start scaling into longs.

ETHEREUM Targeting 4500-4700Ethereum (ETHUSD) hit 2 weeks ago the bottom (Higher Lows Zone) of its 4-year Ascending Triangle pattern, following the recent 3-month correction.

Going Long on ETH with 100x Leverage !Alright, let’s talk about a high-probability setup that I’m trading right now—long ETH, stop-loss at $1,935, take-profit at $2,300. This isn’t just a random entry; it’s based on a super reliable pattern called a Running Flat.
What’s a Running Flat?
A Running Flat is a repetitive market structure that occurs all the time—so often, it feels like an infinite money glitch. It plays out nearly 90% of the time, making it one of the easiest and most profitable patterns to trade.
Think of it like a market cheat code:
📌 It traps early shorts
📌 It creates liquidity for smart money
📌 It explodes in the direction of the trend
And when you spot it? You take the trade, set your stop, and let the magic happen.
Why This ETH Trade?
We’ve got a textbook Running Flat formation
The market is primed for a breakout
The EW 2.0 model confirms the setup
Risk is tightly managed (SL at $1,935 means no overexposure)
100x Leverage – High Risk, High Reward
I know what you’re thinking: 100x leverage? Are you crazy? Well, maybe a little. But when you’re trading a setup with a 90% win rate, it’s all about maximizing opportunity while keeping risk under control. Tight stop, big reward. Simple.
The Trade Plan
✅ Go long ETH
✅ Stop-loss: $1,935 (discipline matters)
✅ Take-profit: $2,300 (targeting the move)
✅ Risk-reward: Favorable and repeatable
Final Thoughts
If this trade works, it’s another example of why Running Flats are pure magic. If it doesn’t? No big deal—we trade the next one.
But history says… we’re about to print money. Let’s see if the infinite money glitch delivers again. 🚀

Ethereum’s Rebound: V-Shaped Surge to an October 2025 PeakI have come today with a new ETH perspective, one that I think is more accurate than my last ETH TA.
Take a look here at how I got this one wrong, mainly because I was counting too much on this diagonal support to hold. Why didn’t it hold? Because there were too many traders looking at it, and when too many people are watching, the opposite happens, and it breaks.
I would advise looking at this TA first before you carry on with this one because the two tie together neatly.
My view is that from here, we will start a V-shaped recovery that will send ETH to $15,000–$18,000 by mid-October 2025. There is a very interesting fractal playing out that I discovered.
So, my alarm went off with this "Wyckoff Spring" indicator. It has only fired off two other times in history: once at the bottom of the COVID crash and the other time at the December 2016 bottom when ETH was just $8. So, I thought, well, let’s take a look to see if the first cycle has anything interesting.
As soon as I flipped to the daily chart, I immediately saw similarities. What if ETH is forming the fractal from the first cycle before the massive run-up? The timeframe and the drawdown percentages are nearly the same, the fractal is nearly identical, and the fact is, the Wyckoff Spring has fired off now, forming this fractal like in 2016. What are the chances…?
When you overlay the fractal, it lines up with mid-October 2025.
I have scanned the entire history of ETH, and I cannot find a fractal closer to this one. This could very well be the pico bottom for ETH this year.

Ethereum Major Breakout Confirmed, Targeting $7800Ethereum has just confirmed a major breakout above a critical resistance zone, signaling a strong bullish continuation. Here's the detailed breakdown:
1.Ascending Triangle Breakout:
ETHUSD had been consolidating within an ascending triangle pattern since late 2024, with the upper resistance around $4000 and a rising support trendline (highlighted in yellow).
The breakout above $4000 on high volume confirms the bullish pattern, often a precursor to significant upward moves.
2. Accumulation Zone:
Prior to the breakout, ETH spent several months in an accumulation zone between $2000 and $4000. This phase allowed buyers to build positions, setting the stage for the current rally.
3. Price Targets:
The measured move of the ascending triangle (height of the pattern) projects a target around $7800. This is calculated by taking the height of the triangle (from the base at $2000 to the resistance at $4000, which is $2000) and adding it to the breakout point ($4000 + $2000 = $6000). However, considering the momentum and historical price action, the next psychological level at $7800 seems achievable.
4. Support Levels:
The previous resistance at $4000 now acts as strong support. If ETH pulls back, this level should hold to maintain the bullish structure.
Additional support lies around $3000, aligning with the 50-day moving average (not shown but inferred from typical setups).
5. Momentum Indicators:
While the chart doesn’t display specific indicators like RSI or MACD, the sharp upward move suggests strong momentum. Traders should watch for overbought conditions on RSI (above 70) as ETH approaches higher levels, which could signal a potential pullback.

ETH MOST POSSIBLE TPSThat is most possible movement from eth
Bottom line
1550-1900
Midtearm tps
Tp1 4000
Tp2 7000
Tp3 10000
Long tearm tps
Tp1 10000
Tp2 25000
Tp3 45000

ETHUSDThello, guys. I hope you are doing great. This is my final call for ETH on daily charts; we have the inverted head and shoulder

ETHEREUM READY FOR TAKEOFF?Hi traders! Analyzing Ethereum (ETH/USD) on the 1H timeframe, spotting a potential entry:
🔹 Entry: 1,840.30 USD
🔹 TP: 1,990.20 USD
🔹 SL: 1,753.70 USD
Ethereum is showing signs of a possible bullish reversal! RSI is near oversold levels, and if momentum picks up, we could see a strong move toward 1,990.20 USD. Eyes on the charts! 📈
⚠️ DISCLAIMER: This is not financial advice. Trade responsibly.

ETH/USD 4-hour chart analysisInstrument: ETH/USD (Ethereum vs. US Dollar)
Timeframe: 4-hour chart
Current Price: Around $1,825
Support Zone: $1,815 - $1,654 (marked in red)
Entry Point: Likely around $1,824.95 (highlighted near the buy setup)
Targets:
1st Target: Around $2,105.89
2nd Target: Around $2,227.71
3rd Target: Around $2,551.64
Final Target: Around $2,730.15
Stop Loss: Likely below $1,815 or around $1,654 (lower red zone)
The trade setup suggests a potential long (buy) trade if price confirms a reversal from the support zone. Let me know if you need further analysis.
Support Levels (S):
1. $1,815 - $1,825 → Strong support zone (current entry area)
2. $1,654 → Major support level (stop-loss area)
Resistance Levels (R):
1. $2,105 - $2,127 → First resistance (Take Profit 1)
2. $2,551 → Second resistance (Take Profit 2)
3. $2,750 - $2,800 → Final resistance (strong supply zone)
These levels act as potential bounce or rejection points. If price holds above support, an upward move is likely, but a break below could trigger a bearish trend. Let me know if you need further insights!

EthereumETHUSD
- Bearish Channel as corrective pattern in Long Time Frame
- Support Level
- Demand Zone
- Completed " 12345 " Impulsive Waves
- Order Block

ETH - is the worst over ? Can we expect reversal ?As shown in the chart, ETH has reached the trendline support and is currently trading near a key support zone. This critical level will determine whether ETH initiates a reversal from its long-term downtrend that began last December.
I anticipate this support to hold, leading to a strong rebound in ETH's price. If the reversal occurs from this zone, ETH could reach its peak around Q4 2025.
Let’s see how it unfolds!
Cheers,
GreenCrypto


ETH - 4 Red Monthly CandlesThis is the second time we’ve seen four consecutive red monthly candles for ETH. The last occurrence was during the 2018 bear market, where ETH crashed 88% from its peak.
This time, the four-month decline has resulted in a 57% drop so far. However, with the price now at a key support zone, I anticipate that the April 2025 candle will be green, signaling a strong recovery—potentially exceeding the previous month’s losses.
If April turns out to be another red month, we could see ETH dropping further toward the $1,300 level before finding a stronger bottom.
Let’s see how this plays out!
Cheers,
GreenCrypto


eth day 3 price prediction date: 3/30/2025eth has started to do my other outcome of having a lower end of wave Z and i think once wave Z is finished it could possibly bounce off of the upport and head bullish or break the support and start a bearish impulse wave.

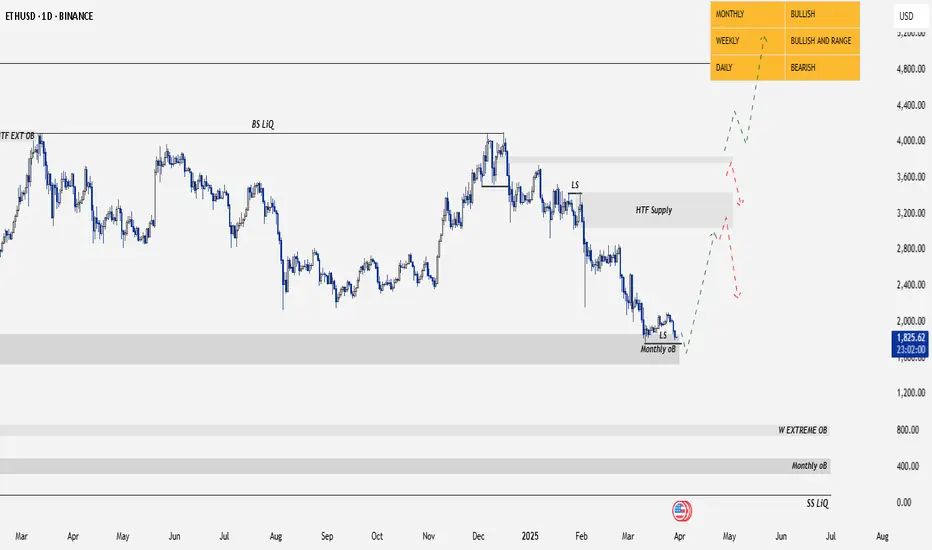
ETH/USDT | Potential Trend Reversal from Monthly Demand Zone📉 Market Overview:
ETH/USDT is currently holding within a strong monthly demand zone, showing signs of possible accumulation. Price has tested this level and indicating a potential reaction.
🔍 Key Trading Conditions:
✅ Liquidity Sweep: If price sweeps the daily previous low, this could be a liquidity grab to trap sellers.
✅ Market Structure Shift (MSS): If price breaks a key lower high to the upside, it would confirm a short term bullish structure shift, signaling a potential trend reversal.
📊 Trade Plan:
🎯 Bullish Confirmation: Wait for a clear MSS to the upside on lower timeframes (4H/1H).
🔹 Entry: After a successful daily low sweep & bullish confirmation.
🔹 SL: Below the liquidity sweep low.
🔹 TP1: Mid-range supply zone.
🔹 TP2: Previous structural highs.
🚨 Risk Management:
Always wait for confirmation before entering.
Monitor price action around key levels.
Manage risk with proper stop-loss placement.
📌 Conclusion:
If ETH sweeps liquidity and shifts structure bullishly, we can expect a potential reversal. Stay patient and let price confirm the move!
📈 Like & Follow for More Market Updates! 🚀