ETHUSD.P trade ideas

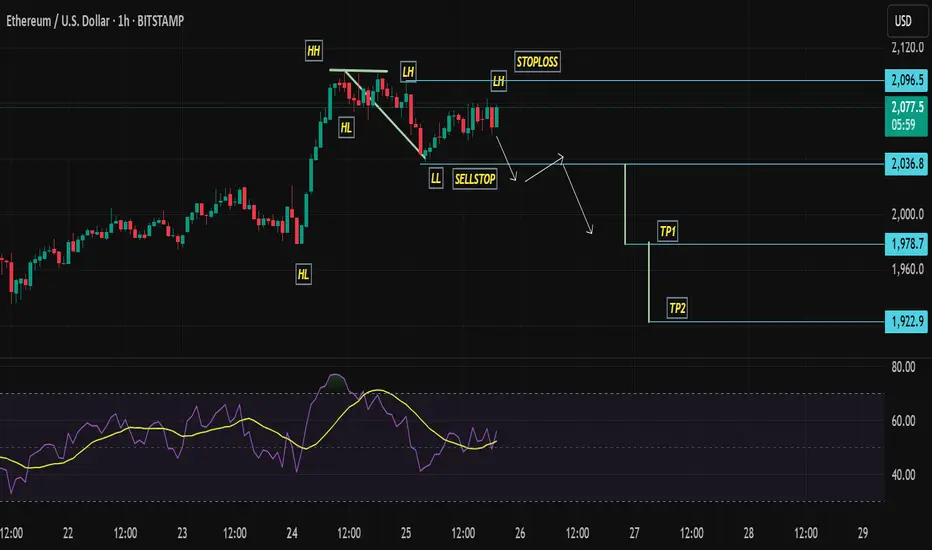
LONGISHBased on market structure, price action and liquidity, expect ETHUSD to move in thos direction.

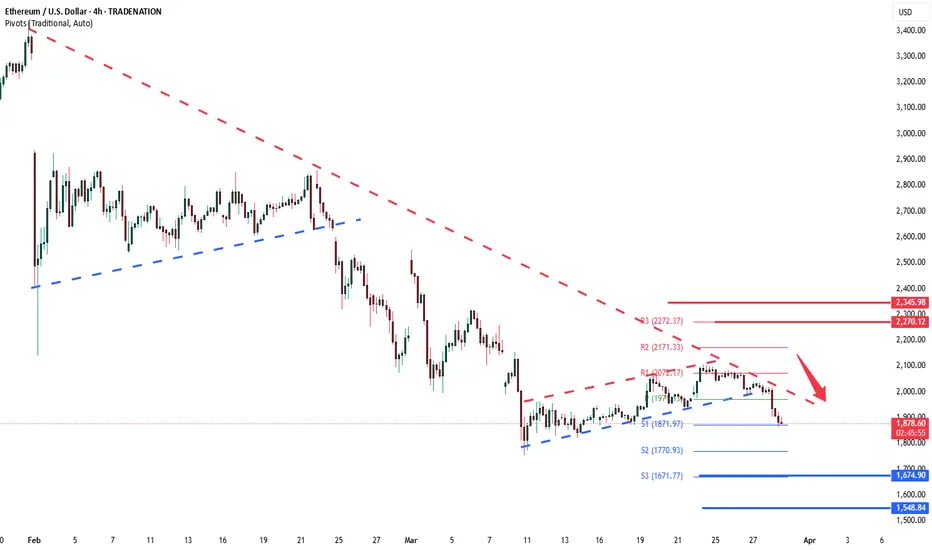
ETHUSD INTRADAY downtrend continuation below 2,171The ETH/USD pair is exhibiting a bearish sentiment, reinforced by the ongoing downtrend. The key trading level to watch is at 2,171, which represents the current intraday swing high and the falling resistance trendline level.
In the short term, an oversold rally from current levels, followed by a bearish rejection at the 2,171 resistance, could lead to a downside move targeting support at 1,872, with further potential declines to 1,770 and 1,670 over a longer timeframe.
On the other hand, a confirmed breakout above the 2,171 resistance level and a daily close above that mark would invalidate the bearish outlook. This scenario could pave the way for a continuation of the rally, aiming to retest the 2,272 resistance, with a potential extension to 2,345 levels.
Conclusion:
Currently, the ETH/USD sentiment remains bearish, with the 2,171 level acting as a pivotal resistance. Traders should watch for either a bearish rejection at this level or a breakout and daily close above it to determine the next directional move. Caution is advised until the price action confirms a clear break or rejection.
This communication is for informational purposes only and should not be viewed as any form of recommendation as to a particular course of action or as investment advice. It is not intended as an offer or solicitation for the purchase or sale of any financial instrument or as an official confirmation of any transaction. Opinions, estimates and assumptions expressed herein are made as of the date of this communication and are subject to change without notice. This communication has been prepared based upon information, including market prices, data and other information, believed to be reliable; however, Trade Nation does not warrant its completeness or accuracy. All market prices and market data contained in or attached to this communication are indicative and subject to change without notice.
ETHUSD Buy Opportunity – Key 30m POI Support Zone COINBASE:ETHUSD
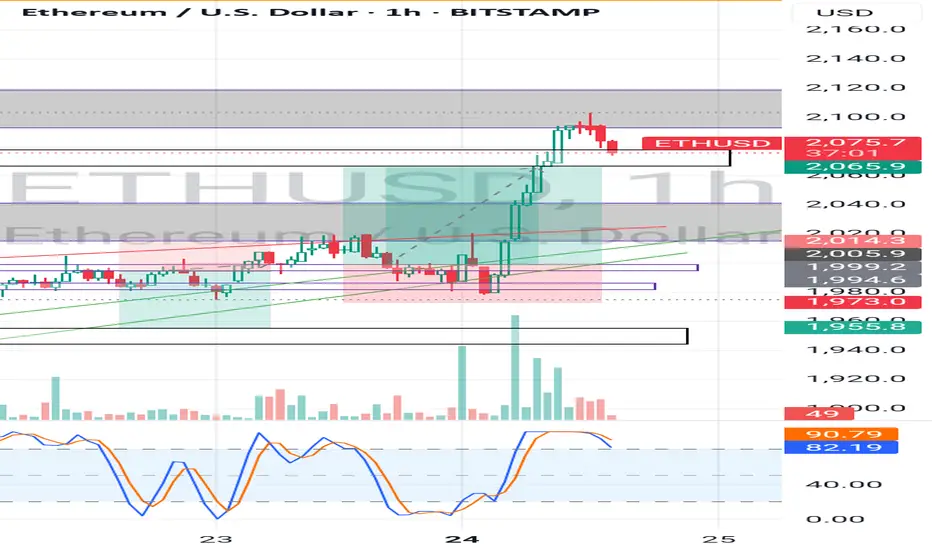
Ethereum (ETH/USD) has reached a key 30m POI (demand zone) at 1,987 - 1,994 , offering a potential buy opportunity. If this level holds, we could see a push toward 2,066.85.
📌 Trade Setup:
✅ Entry: 1,994.64
✅ Take Profit: 2,066.85
✅ Stop Loss: 1,978.50
A strong reaction here could trigger a bullish move. Are you taking this trade? 🚀

ethuusd buying change1 day support retest and reject
so next tp wealy support
tp 1 is 1 day last high CRYPTO:ETHUSD

ETHUSD-BUY strategy 6 hourly KAGI chartIt feels possible that we may have seen a temporary bottom for ETH for the short-term. We are basing, and the change is of $ 2,350 test again.
Long-term seeing much lower levels, but its as noted a short-term chart and idea.
Strategy BUY current $ 1,875- 1,950 and take profit near $ 2,275 for now.

1 day chart eth price prediction date:3/26/2025using the triangle elliotwave and gann fan predicting a possible outcome of 3k on ethereum

daily price prediction for eth 2hr date:3/26/2025using the elliott wave pattern and gann fan i have found a possible outcome for BINANCE:ETHUSD to go around 3000$

ETHDISCLAMER ON !!!!
ETH Support $1.749 and target $2.600
The market is not yet bullish in the short term, so buying must be disciplined cutloss
For the long term, you can buy in installments

ETHUSDBearish trend with bear continuation flag and double top formation. indicating a possible bearish trend.
Ethereum (ETH/USD) Bullish Breakout – Eyes on $2,500+ Target 📈 Chart Overview:
Timeframe: 4H (Ethereum/USDT)
Trend Reversal: Ethereum has broken out of a falling wedge pattern, indicating a shift from bearish to bullish momentum.
Support Level: Around $1,800 - $1,900, where price previously found strong buying interest.
Retest Confirmation: ETH successfully retested the breakout level (~$2,020), confirming a potential bullish continuation.
Resistance Zone: The next key resistance area is around $2,250, followed by a potential move towards the $2,530 - $2,550 target zone.
📊 Trade Setup:
Bullish Bias: Price action suggests an upward move towards $2,250 and potentially $2,530.
Risk Management: A stop-loss can be set below $2,020 to minimize downside risk.
🔥 Conclusion: If Ethereum maintains momentum above the retest zone, it could see a strong rally in the coming days! 🚀

Ethereum elliot wave cycleEthereum has tested the price in the 1800 zone and in the low zone of the trend after an ABC correction in 3 moves which could give more pullback moves to go up maybe it could reach 1500 and then go up.

LTCUSD INTRADAY at decisive point Technical Analysis of LTC/USD
Trend Overview: LTC/USD exhibits a neutral sentiment within a prevailing range-bound trading structure. The recent price action suggests an oversold bounce-back, forming a bearish sideways consolidation. This indicates indecision in the market, with neither bulls nor bears taking full control.
Key Levels:
Resistance: 960.00, 988.50, 1031.40
Support: 883.00, 840.10, 808.80
Price Action Analysis: The key resistance level at 960.00 serves as a crucial pivot point. An oversold rally from current levels could face rejection at this zone, leading to further downside movement. Failure to break this resistance may result in renewed bearish momentum, targeting lower support levels at 883.00, followed by 840.10 and 808.80 in the longer timeframe.
Alternatively, a confirmed breakout and daily close above 960.00 would shift sentiment to bullish, potentially opening the door for an upward move towards 988.50 resistance. Further bullish momentum could drive LTC/USD to 1031.40, reinforcing a stronger uptrend.
Conclusion: LTC/USD remains in a consolidation phase, with the 960.00 level acting as a decisive point for future price direction. A bearish rejection at this level could reinforce a downward trajectory, while a breakout above it would invalidate the bearish bias, signaling potential further gains. Traders should closely monitor price action near 960.00 to assess the next significant move.
This communication is for informational purposes only and should not be viewed as any form of recommendation as to a particular course of action or as investment advice. It is not intended as an offer or solicitation for the purchase or sale of any financial instrument or as an official confirmation of any transaction. Opinions, estimates and assumptions expressed herein are made as of the date of this communication and are subject to change without notice. This communication has been prepared based upon information, including market prices, data and other information, believed to be reliable; however, Trade Nation does not warrant its completeness or accuracy. All market prices and market data contained in or attached to this communication are indicative and subject to change without notice.

ETHUSD Bearish Continuation pattern resistance at 2,171The ETH/USD pair is exhibiting a bearish sentiment, reinforced by the ongoing downtrend. The key trading level to watch is at 2,171, which represents the current intraday swing high and the falling resistance trendline level.
In the short term, an oversold rally from current levels, followed by a bearish rejection at the 2,171 resistance, could lead to a downside move targeting support at 1,872, with further potential declines to 1,770 and 1,670 over a longer timeframe.
On the other hand, a confirmed breakout above the 2,171 resistance level and a daily close above that mark would invalidate the bearish outlook. This scenario could pave the way for a continuation of the rally, aiming to retest the 2,272 resistance, with a potential extension to 2,345 levels.
Conclusion:
Currently, the ETH/USD sentiment remains bearish, with the 2,171 level acting as a pivotal resistance. Traders should watch for either a bearish rejection at this level or a breakout and daily close above it to determine the next directional move. Caution is advised until the price action confirms a clear break or rejection.
This communication is for informational purposes only and should not be viewed as any form of recommendation as to a particular course of action or as investment advice. It is not intended as an offer or solicitation for the purchase or sale of any financial instrument or as an official confirmation of any transaction. Opinions, estimates and assumptions expressed herein are made as of the date of this communication and are subject to change without notice. This communication has been prepared based upon information, including market prices, data and other information, believed to be reliable; however, Trade Nation does not warrant its completeness or accuracy. All market prices and market data contained in or attached to this communication are indicative and subject to change without notice.

Bull run the next targets First Target 2505$ 🎯
Second Target 3284$ 🎯
Third target 3757$ 🎯
Mega Target 5k and 8k ( only use 25% of your profit from the first three targets, Don't use you capital investment on the last target please.)

Range or drop for the 4H chartIn the 4H chart in futures operations, the price at this moment is in a NON-OPERABLE AREA, since we would wait for the time for the price to retrace or make a range and purchase positions are reopened

ETHUSD – Bullish Quasimodo + iH&S Breakout | Upside Targets!Ethereum (ETHUSD) has completed a textbook bullish Quasimodo pattern in confluence with an Inverse Head & Shoulders (iH&S) on the 15-minute timeframe. Price has broken out with strong bullish momentum, and the structure suggests more upside ahead.
📊 Technical Breakdown
1. Quasimodo Pattern
A well-defined Quasimodo reversal formed at the swing low, providing early signs of a bullish trend shift.
This pattern combines a higher low and reclaimed structure—offering an excellent base for trend continuation.
2. Inverse Head & Shoulders
Left Shoulder, Head, and Right Shoulder clearly structured with neckline breakout confirmed.
Breakout above neckline resulted in a 5.38% rally into minor resistance.
3. Bull Flag Formation
A short consolidation just below the recent highs resembles a bull flag, typically a continuation signal.
Breakout from the flag would trigger the next leg toward the final target.
🎯 Targets
Minimum Target: 2,121.41 — aligns with neckline projection.
Final Target: 2,229.90 — 6.27% projected move based on iH&S measured move.
📌 Trade Idea
Entry Zone: On bull flag breakout above 2,093
Stop Loss: Below 2,060 (flag low support)
TP1: 2,121
TP2: 2,229
🔎 Key Confluences
Pattern Breakouts ✅
Strong Momentum ✅
Clean Structure & Price Geometry ✅
ETH bulls have reclaimed short-term control. If momentum sustains, the upside targets are well within reach.

ETH/USD – Bullish Breakout & Buying OpportunityEthereum has broken out of a descending channel and is consolidating near a key support zone. The price action suggests a potential bullish continuation, with a buying opportunity forming above the $2,000 - $2,100 support level.
Key Levels to Watch:
Support: ~$2,000, ~$1,800
Resistance Zone: ~$2,250
Target: ~$2,530
Trading Plan:
Buy Entry: On breakout and retest above $2,250
Stop-Loss: Below $2,000
Take-Profit: $2,530
If Ethereum successfully breaks resistance with volume confirmation, it could rally toward $2,500+, making this a strong bullish setup. Keep an eye on price action for confirmation. 🚀

How "Max Pain" Can Become Your Ally in ETH TradingImagine standing on the edge of a cliff, peering down at a raging river below. That’s the feeling traders experience as the options expiration date approaches. At this moment, all bets are off, and the market is primed for sharp movements. Have you ever wondered how to turn this uncertainty into an advantage?
Let’s break it down. The ETH market is buzzing with tension: open interest in options is soaring, and the ratio of in-the-money to out-of-the-money puts stands at 48% to 52%. This means nearly half of all puts have intrinsic value. Professional market participants, like skilled magicians, hedge their positions, transforming them into delta-neutral setups.
But how do they do this? Right, by buying futures! This is the hidden growth driver we’ve been witnessing over the past few days. While I won’t dive into other factors like news, it’s crucial to understand that this dynamic could be the key to success.
Now, let’s talk about “Max Pain.” The Max Pain level for this options series landed on the March 2nd trigger point, where we saw a powerful bullish candle. But are the bulls stuck there? I’m pretty sure they are. Now, we’re left to watch whether the market can break free from this grip.
Personally, I see an opportunity to open a short position. But let’s see if the “law of gravity” will hold true for Max Pain this time.
Stay tuned If you want to stay updated on forex and crypto trading nuances!

ETHUSD New trendETHUSD has currently successfully broken through the resistance level of 2,100 and has re-entered a new range.
Hold for the long term
💎💎💎 ETHUSD 💎💎💎
🎁 Buy@2050 - 2080
🎁 TP 2200 2300 2400 2500
The market has been extremely volatile lately. If you can't figure out the market's direction, you'll only be a cash dispenser for others. If you also want to succeed,Follow the link below to get my daily strategy updates

ETH/USD Breakout – Long Position Activated!Hi Traders ! Ethereum on the 1H chart has been trading within a descending channel and is now testing the upper boundary. I’ve placed a long entry expecting a breakout, targeting the $2,061 - $2,070 zone. Stop-loss set in case of a false breakout. RSI is showing signs of recovery. Let’s see how it plays out! 🔥👀
Disclaimer: This is not financial advice. Trade at your own risk. 🚨

ETH USD LONG RESULT After closing the Short at Break Even, I wait for price to reach and hold from the now support and opened a long position of which went better than planned.
_ THE _ KLASSIC _ TRADER_.
ETH ready for a rebound towards 2.5k- after breaking the magical line of 2000$, expectation was that the final capitulation for ETH has started
- that did not happen however and ever since that 2k break, bulls have consistently shown strength on low time-frames
- with the recent S/R flip, it is likely ethereum and by extension the entire crypto market gets a relief rally
- Bitcoin could go all the way to 110k however, if that happens, it is likely the move is going to be a short
