EURGBP Bearish Optimism.Hi there,
EURGBP appears bearish on the M15, with a target zone of 0.86010 to 0.85876 and a directional bias at 0.85492
We reached Wave 5, so theoretically the price will seek outside liquidity. Let's see how it plays out.
Happy Trading,
K.
Not trading advice
EURGBP.P trade ideas

EUR/GBP SHORT FROM RESISTANCE
Hello, Friends!
EUR-GBP uptrend evident from the last 1W green candle makes short trades more risky, but the current set-up targeting 0.852 area still presents a good opportunity for us to sell the pair because the resistance line is nearby and the BB upper band is close which indicates the overbought state of the EUR/GBP pair.
Disclosure: I am part of Trade Nation's Influencer program and receive a monthly fee for using their TradingView charts in my analysis.
✅LIKE AND COMMENT MY IDEAS✅

EURGBP Massive Short! SELL!
My dear subscribers,
EURGBP looks like it will make a good move, and here are the details:
The market is trading on 0.8674 pivot level.
Bias - Bearish
Technical Indicators: Both Super Trend & Pivot HL indicate a highly probable Bearish continuation.
Target - 0.8620
About Used Indicators:
The average true range (ATR) plays an important role in 'Supertrend' as the indicator uses ATR to calculate its value. The ATR indicator signals the degree of price volatility.
Disclosure: I am part of Trade Nation's Influencer program and receive a monthly fee for using their TradingView charts in my analysis.
———————————
WISH YOU ALL LUCK

EURRGBP currently in correction phaseEURGBP Made 3 green candles after breaking the channel resistance and now in correction phase likely to go 0.85. let us see.

EURGBP: A Multi-Time Frame AnalysisEURGBP: Range Trading Opportunity
EUR/GBP recently tested a strong resistance zone near 0.8470, showing for a possible price reaction. The same zone pushed the price downward several times.
We have to be careful as the situation is not that stable from Trump's tariffs but it could be the case for EURGBP to respect the same pattern again. Based on historical price behavior, there is potential for the pair to move downward again.
You may find more details in the chart!
Thank you and Good Luck!
❤️PS: Please support with a like or comment if you find this analysis useful for your trading day❤️
Disclosure: I am part of Trade Nation's Influencer program and receive a monthly fee for using their TradingView charts in my analysis.

EURGBP - Shorts/Sellsfor self Journaling purposes only, this does not constitute financial advice.
One a top forms and closes around the entry mark I will look to take sells. Detailed in the charts.
EUR/GBP 1H Analysis – Bearish Setup🕒 Timeframe: 1 Hour
💱 Pair: EUR/GBP
📍 Entry: 0.86129
🎯 TP (Take Profit): 0.84807
🛑 SL (Stop Loss): 0.86565
📊 Risk-Reward: ~1:3.2
🧠 Trade Idea:
This is a Fib-based reversal setup following a strong bearish leg. Price retraced back into a key supply zone, lining up perfectly with:
🔹 61.8% - 88.6% Fib Retracement
🔹 Prior structure resistance
🔹 Bearish reaction from 0.86626 high
🔍 Key Levels:
Fib Retracement Zone: 0.86079 – 0.86463
Major Resistance: 0.86626 (Previous high)
Key Support/TP Zone: 0.84807 (-27% Fib Extension)
🔥 Trade Execution:
🔻 Entered short at 0.86129
📉 Targeting the extension zone near 0.84800, which aligns with the projected bearish continuation move.
📈 SL just above 88.6% Fib and structure at 0.86565

Eurgbp 11 Apr 2025 updatePrice move down as expected but not as what was expected.
However, this move to new high is expected to be the last before a break lower.
Watch for TLB or candlestick to signal the reversal and start to add shorts.
Good luck.

correction It is expected that the trend will change within the current resistance range and we will see the start of the correction trend. Then, it is expected that the upward trend will continue.

EUR/GBP Analysis Double Bottom Breakout Toward TargetOverview of the Chart
This chart displays a EUR/GBP daily timeframe setup, highlighting a Double Bottom Pattern, a well-known bullish reversal formation. The pattern consists of two consecutive lows at a similar price level, followed by a breakout above a key resistance zone. This setup suggests a potential trend reversal from bearish to bullish.
Technical Analysis Breakdown
1. Double Bottom Formation (Reversal Signal)
Bottom 1: The first low was established after a prolonged downtrend, where the price found support and bounced higher.
Bottom 2: Price revisited the same support area but failed to break lower, indicating that sellers are losing strength and buyers are stepping in.
A double bottom pattern signals that the asset is forming a strong base and is likely to move higher after breaking the neckline (resistance level).
2. Support and Resistance Levels
Support Level (~0.8322):
This level acted as a demand zone, preventing further downside.
It marks the price area where buyers accumulated positions, leading to a reversal.
Resistance Level (~0.8500):
This level previously acted as a supply zone, where sellers controlled the price.
A breakout above this level is crucial to confirm the bullish trend continuation.
3. Breakout Confirmation & Retest Expectation
The price successfully broke above the resistance zone, confirming a bullish reversal.
A potential retest of the broken resistance (now turned support) could occur before further upside movement.
Traders often wait for this retest to confirm that the breakout is genuine before entering a position.
4. Price Target Projection
Based on the measured move strategy, the expected target is calculated by measuring the height of the double bottom pattern and projecting it above the breakout zone.
Target Price: 0.8742, aligning with historical resistance levels.
5. Stop Loss Placement
Stop loss at ~0.8322 (below the double bottom support).
This ensures risk is managed in case of an invalid breakout or a false move.
Trading Plan & Execution Strategy
📌 Entry Strategy:
✅ Breakout Entry: Buy after the breakout above resistance.
✅ Retest Entry: Wait for a pullback to the previous resistance (now support) before entering.
📌 Risk Management:
🔹 Stop Loss: Placed below the recent support at 0.8322 to limit downside risk.
🔹 Take Profit: First target at 0.8742 based on the double bottom structure.
📌 Market Outlook:
A successful breakout and bullish momentum could push prices toward the target.
If the price fails to hold above the breakout zone, a deeper retracement could occur before continuing higher.
Conclusion
The EUR/GBP pair has formed a bullish double bottom reversal pattern, signaling a potential uptrend continuation. The key levels to watch include 0.8500 (resistance turned support) and 0.8742 (target projection). Traders should monitor price action around the breakout zone for confirmation and consider risk management strategies before entering a position.

EURGBP SHORT FORECAST Q2 W15 D11 Y25EURGBP SHORT FORECAST Q2 W15 D11 Y25
Good day Traders!
Take a look at this potential short setup on EURGBP!
It has indeed been a slow week, perhaps we can capitalise on some price action to gain Fun coupons on Friday ! Price action currently sat in the higher time frame order block. For us that means our directional bias is against current trends however, as always if we see shifts and signs in that bullish pressure. Our management skills come into play.
We are currently forecasting a rejection form the weekly order block that was created Christmas week of 2023 of which shifted price action below 0.86607 until now.
Let's see if we price will come to us in a way of bearish price action.
More info on this setup later.
FRGNT X

EURGBP SHORT FORECAST Q2 D9 W15 Y25EURGBP SHORT FORECAST Q2 D9 W15 Y25
Welcome back Traders! Here's my take.
We have two points of interest here. As always you know how we look into every play. It is imperative we have a turn around of price action prior getting involved even more so when the point of interest is not an order block.
My reasoning behind selection of the weekly/daily highs is simply due to how it aligns with market structure. IF we break the most recent Asia lows from that point of interest followed by a pull back into an order block that would have been created and left behind as a result. The short position will be entertained.
With the above said, in reflection I am already having second thoughts but feel free ti dive into the way I chart and analysis. Would I risk capital from simply a high? It does not seem "smart".
The above is scrapped and we must wait for price action to enter into the daily order block. Let us await a reaction from the area and again, show signs of a turn around. Await for 1'/5' break of structure and lower time frame order block creation.
THEN! We arm our capital and take the short position for what I can foresee will be a worthwhile risk to reward.
Trade well!
FRGNT X

EURGBP-SELL strategy 12 hourly chart RegressionThe pair still has moved higher, but it does not deter us from adding to SHORTS... the pair is overbought and correction is needed.
Strategy SELL @ 0.8600-0.8635 and take profit near 0.8478 for now.

we start the week with a good profit during the 4 hoursAs we see, the resistance level has been broken and a confirmation is formed that the price will rise higher, we watch carefully and when we see that an STC has been made, we act with a purchase.

EURGBP → False break of liquidity zone (resistance)FX:EURGBP within the distribution (news background) tests resistance 0.84616 and liquidity zone, but without the possibility of continued growth the price forms a false breakout
The dollar index falls amid Trump's introduction of new tariffs, which generally provokes a rally in the whole market. But before NFP, the market shifts to profit-taking because of the growing risks. There are quite important news ahead, which may provoke high volatility.
Technically, after a strong move, the currency pair forms a false resistance breakout and consolidates in the selling zone. If the bears keep the price below 0.84616, in the short term we should wait for a correction to 0.5 fibo or to the fvg zone.
Resistance levels: 0.84600
Support levels: 0.8427, 0.8396
The situation is quite complicated due to unstable background, but technically we have a classic situation with a false breakout of strong resistance, and as we know, according to statistics, the strongest movements start after it (in relation to the trade of level breakout).
Regards R. Linda!

EURGBP: Short Trading Opportunity
EURGBP
- Classic bearish pattern
- Our team expects retracement
SUGGESTED TRADE:
Swing Trade
Sell EURGBP
Entry - 0.8451
Stop - 0.8489
Take - 0.8371
Our Risk - 1%
Start protection of your profits from lower levels
Disclosure: I am part of Trade Nation's Influencer program and receive a monthly fee for using their TradingView charts in my analysis.
❤️ Please, support our work with like & comment! ❤️

EUR/GBP (1H) – Rising Wedge Breakdown & Short Trade Setup1. Overview of Market Structure
The EUR/GBP pair is forming a Rising Wedge Pattern, a well-known bearish reversal formation, which suggests that the current uptrend may soon reverse into a downtrend. The price has been moving within a tightening range, making higher highs and higher lows, but the upward momentum appears to be weakening.
A breakdown from this wedge is a strong bearish signal, indicating that sellers are gaining control, and a significant price drop is expected.
2. Chart Pattern: Rising Wedge – Bearish Reversal
A Rising Wedge is a pattern that occurs when price moves upward within a contracting range. This pattern typically forms after an uptrend and suggests that bullish momentum is slowing down.
Characteristics of the Rising Wedge in This Chart:
The price has tested the upper resistance zone multiple times, but each attempt has resulted in a rejection.
The lower support trendline has been tested frequently, showing that buyers are losing strength.
The breakdown of the wedge signals a strong bearish move, with price expected to drop toward key support levels.
This pattern becomes valid once the price breaks below the lower trendline, confirming the bearish outlook.
3. Key Technical Levels & Zones
A. Resistance Zone (0.84853) – Strong Supply Area
Marked as a Resistance Zone, where price has struggled to break through.
Sellers have stepped in around this level multiple times, preventing any further bullish movement.
Acts as a major stop-loss level for bearish trades, as a breakout above this zone could invalidate the setup.
B. Support Zones (Potential Take-Profit Targets)
1st Support Level (TP1) – 0.82539
This level has previously acted as strong support, where buyers have entered the market before.
A short-term pullback or consolidation may occur here.
2nd Support Level (TP2) – 0.81332
This is the final bearish target, marking a key demand zone from where price has bounced in the past.
If bearish momentum continues, price could reach this level, making it an ideal take-profit zone for swing traders.
4. Trading Strategy & Execution
A. Entry Strategy
A short trade is ideal after the price breaks below the rising wedge pattern. There are two possible entries:
Aggressive Entry:
Enter immediately after the breakout of the lower trendline, anticipating strong downside momentum.
Higher risk as price might retest the trendline before moving down.
Conservative Entry:
Wait for a retest of the broken trendline before entering short.
This confirms the breakdown, reducing false breakout risks.
B. Stop-Loss Placement
Stop-loss should be placed just above the resistance zone (0.84853).
This prevents being stopped out by minor pullbacks before the actual move happens.
C. Take-Profit Targets
TP1: 0.82539 (First major support level – potential profit booking area)
TP2: 0.81332 (Final bearish target – strong demand zone)
5. Risk Management & Trade Management
Risk-to-Reward Ratio (RRR)
This trade offers a high RRR, making it an attractive setup.
The stop-loss is small compared to the potential downside move.
Trailing Stop Strategy
A trailing stop can be used to lock in profits as price moves lower.
If price reaches TP1, move stop-loss to breakeven to secure capital.
If price reaches TP2, close the trade for maximum profit.
Exit Strategy
Exit early if price fails to break key support zones.
Monitor price action around TP1 & TP2 for signs of reversal.
6. Sentiment Analysis & Market Context
Bearish Confirmation:
Breakdown from the wedge signals bearish sentiment in the market.
If price fails to sustain above support zones, further downside is likely.
News & Fundamentals:
Major economic events or interest rate decisions could impact EUR/GBP volatility.
Traders should check for UK & Eurozone news before entering the trade.
7. Conclusion – Bearish Outlook
The Rising Wedge breakdown is a strong short-selling opportunity.
Confirmation is key: Enter short after the breakdown, use proper risk management, and aim for TP1 & TP2.
If price invalidates the pattern by breaking above 0.84853, the trade setup should be reconsidered.
This setup provides a high-probability bearish trade with a well-defined stop-loss and risk-to-reward ratio.

Short trade
15min ~TF overview
📉 Trade Breakdown – Sell-Side (EUR/GBP)
📅 Date: Thursday, April 10, 2025
⏰ Time: 12:30 PM (NY Time) – NY Session AM
📈 Pair: EUR/GBP
🧭 Direction: Short (Sell)
📐 Structure/Concept: Based on PD Array reference (0.5 Target)
Trade Parameters:
Entry: 0.86418
Take Profit (TP): 0.86102 (–0.37%)
Stop Loss (SL): 0.86609 (+0.22%)
Risk-Reward Ratio (RR): 1.65
Reason: price reaching a pivotal price level and making a higher high (NY Session) suggests an indication of a sellside trade idea.


Sell EURGBPLet us try to sell EURGBP one more time. Yesterday we got turned into liquid, but it is a new day. I see a double top at play here hence my bearish sentiment

EUR-GBP Bullish Bias! Buy!
Hello,Traders!
EUR-GBP is trading in a
Strong uptrend and the pair
Made a bullish breakout of
The key horizontal level
Of 0.8623 then surged
Further up and is now
Making a local bearish
Correction so we are
Bullish biased and after
The retest of the new
Support level we will be
Expecting a further
Bullish move up
Buy!
Comment and subscribe to help us grow!
Check out other forecasts below too!
Disclosure: I am part of Trade Nation's Influencer program and receive a monthly fee for using their TradingView charts in my analysis.

EURGBP INTRADAY bullish breakout supported at 0.8450EUR/GBP maintains a bullish bias, supported by the prevailing upward trend. Recent intraday movement indicates a corrective pullback toward a key consolidation zone, offering a potential setup for trend continuation.
Key Support Level: 0.8450 – previous consolidation range and pivotal support
Upside Targets:
0.8576 – initial resistance
0.8616 and 0.8650 – extended bullish targets on higher timeframes
A bullish reversal from 0.8450 would suggest continuation of the uptrend, confirming buying momentum.
However, a decisive break and daily close below 0.8450 would invalidate the bullish structure, opening the door for further retracement toward 0.8417, with additional support at 0.8400 and 0.8373.
Conclusion
EUR/GBP remains bullish above 0.8450. A bounce from this level supports further gains toward 0.8576. A close below 0.8450 would shift the outlook bearish, exposing downside risk toward 0.8373.
This communication is for informational purposes only and should not be viewed as any form of recommendation as to a particular course of action or as investment advice. It is not intended as an offer or solicitation for the purchase or sale of any financial instrument or as an official confirmation of any transaction. Opinions, estimates and assumptions expressed herein are made as of the date of this communication and are subject to change without notice. This communication has been prepared based upon information, including market prices, data and other information, believed to be reliable; however, Trade Nation does not warrant its completeness or accuracy. All market prices and market data contained in or attached to this communication are indicative and subject to change without notice.

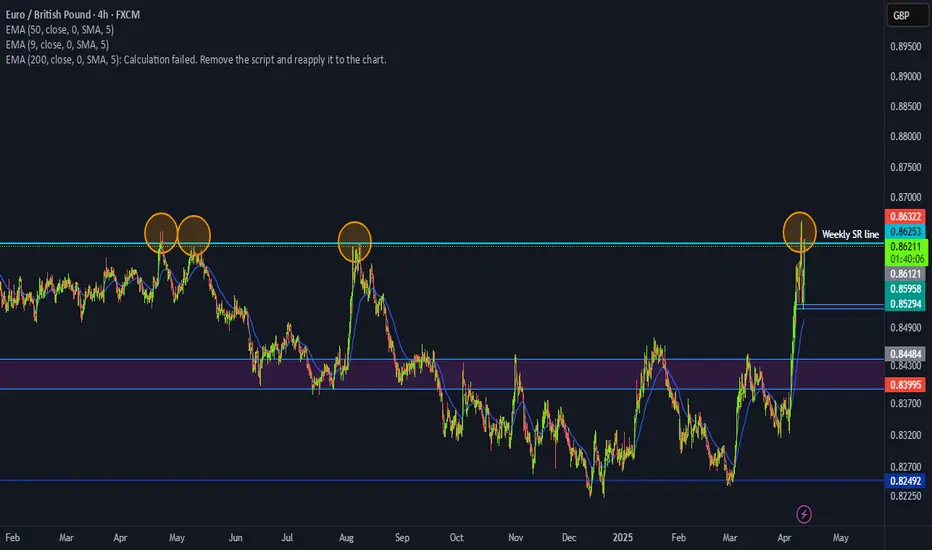
EURGBPPossibility of a short swing trade!
-plenty of supply highlighted in the circled area
- Hit Weekly SR line and retracted previously
- could we see a downfall of the euro?
could we see a breakthrough retest and then carry on a bullish trend?