Time to buy EURGBPEURGBP at a strong demand area and now it is time to buy this pair. Risk rewards is 1:2 . Use money management always. Good luck with the trade !
EURGBP.P trade ideas

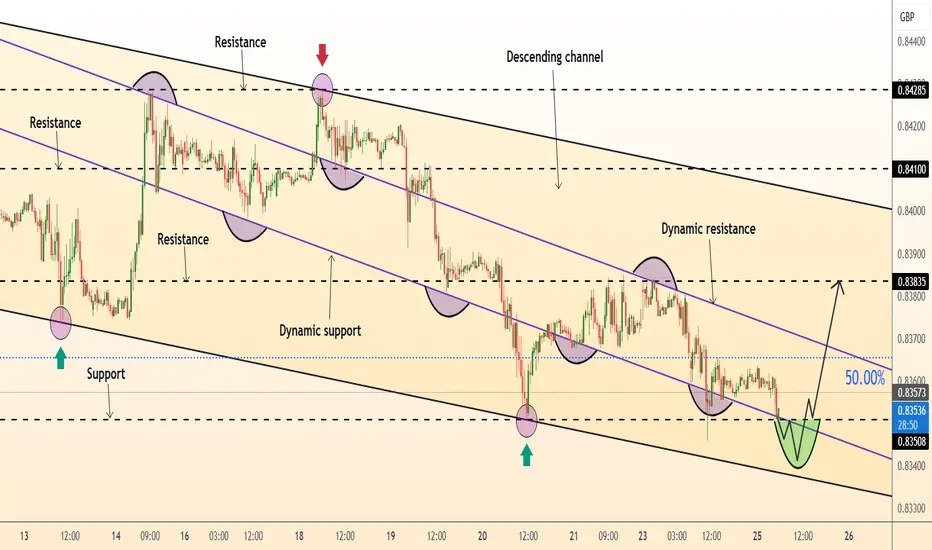
DeGRAM | EURGBP retest of supportEURGBP is in a descending channel between trend lines.
The price is moving from the lower boundary of the channel and now has fallen back to the support level.
The volatility of the chart has decreased.
On the 1H Timeframe, the indicators have formed a bullish convergence, which has not yet worked out.
We expect a rebound from the support.
-------------------
Share your opinion in the comments and support the idea with like. Thanks for your support!
Eur/Gbp LongWait for price to pull back to support before entering longs. Lower support area is good for entering longs too.
First position can be taken at 0.83200 and second at 0.82240
SL under major lows
TP at 0.86000
This is not a investment advice only idea. I am retailtrader without any education in economics. I trade my own money only. As always make your own analysis first.

EURGBP Set To Fall! SELL!
My dear friends,
EURGBP looks like it will make a good move, and here are the details:
The market is trading on 0.8359 pivot level.
Bias - Bearish
Technical Indicators: Supper Trend generates a clear short signal while Pivot Point HL is currently determining the overall Bearish trend of the market.
Goal - 0.8344
About Used Indicators:
Pivot points are a great way to identify areas of support and resistance, but they work best when combined with other kinds of technical analysis
Disclosure: I am part of Trade Nation's Influencer program and receive a monthly fee for using their TradingView charts in my analysis.
———————————
WISH YOU ALL LUCK

eurgbp 27 Mar inverted head and shoulderA possible ihns is forming, loading some long and will load more when price closed above neckline
Good luck

Euro / British Pound - 30 - OANDAThis chart represents the **Euro (EUR) / British Pound (GBP) currency pair on a 30-minute timeframe**, published on **TradingView**. It highlights a key **support area** and a potential **long (buy) trade setup**.
### **Key Elements in the Chart:**
1. **Support Area (Highlighted in Black Box)**
- This region (~0.8345 - 0.8355) is marked as a key support zone where price has historically bounced.
- Buyers are expected to enter at this level to push the price higher.
2. **Trade Setup:**
- **Entry Zone:** Near the support area (~0.8355).
- **Stop-Loss (SL):** Placed at **0.83510**, slightly below the support area, to limit downside risk.
- **Take-Profit (Target):** Set at **0.8400**, where the price is expected to rise.
- **Risk-to-Reward Ratio:** The trade aims for a favorable upside while keeping risk minimized.
3. **Background Colors & Highlights:**
- Yellow background for the overall chart.
- Green zone (above entry) represents the potential profit target.
- Orange/red zone (below entry) represents the stop-loss level.
### **Possible Market Scenario:**
- If price **holds above the support area**, a bullish move toward the **0.8400 target** is expected.
- If price **breaks below the support area**, the trade may be invalidated, leading to a stop-loss trigger.
This chart suggests a **bullish bias** based on support holding. Let me know if you need further insights! 🚀📈

Eurgbp 26 MarPrice had reached lower channel and should be bullish at least for the short term
Had loaded long positions here, will be looking for a break above resistant line for more bullish view to trigger
Good luck

SHORT ON EUR/GBPPrice is currently pulling back from its over uptrend on this pair.
Just following the current downtrend structure looking to make 80-100 pips to the next demand zone or imbalance.

Retracement of EURGBP Expected after data .Shorting EURGBP at 0.8368 after this morning's data
200 Hourly EMA providing technical resistance
Running into a cluster of previous volume areas
Overall recent trend is still bearish .
Despite the data this morning giving GBP a push lower , this move appears way too aggressive for the data and likely more position covering than fundamental given that :
Bank of England still expect inflation to peak at 3.75% in Q3
Energy , Tarriffs and general uncertainty in the market
Some analyst still calling for 4% in April and May
I think perhaps a high probability reversal here from the overstretch -as always I'll look for a quick trade with good risk reward .
Stop 0.8392
Entry 0.8368
Target 0.8328
E.

EUR/GBP 4H | Sell Opportunity After Resistance Rejection The EUR/GBP pair has been in a downtrend, with lower highs and lower lows forming. Recently, price rejected a key resistance zone and is now continuing its bearish momentum.
🔎 Key Observations:
✅ Resistance Levels: 0.83598 - 0.83910 acted as a strong rejection zone.
✅ Sell Confirmation: Price has broken below minor support and is now moving downward.
✅ Bearish Expectation: The next major support target is 0.82618.
📌 Trading Plan:
🔻 Sell on pullbacks near resistance levels (0.83598 - 0.83676).
🔻 Target: 0.82618 as the next key support.
🔻 Stop-loss: Above 0.83827 to minimize risk.
🚨 Risk Management Tip: Always maintain a good risk-reward ratio and wait for confirmations.
💬 What’s your take on this setup? Are you looking to sell or waiting for a better entry?

Eurgbp 24 Mar 2025Nice risk reward ratio, pending price to close above resistant line to confirm and spike higher
Good luck

EURGBP 24.03.2025~+ Germany Services PMI Miss, UK Services PMI Beat (mixed with good Mfg PMI and good FR data)
+ Bearish eur COT
+ Seasonality

EUR/GBP Chart Analysis – Inverse Head & Shoulders Bullish SetupThis EUR/GBP 1-hour chart showcases a classic Inverse Head & Shoulders (H&S) pattern, signaling a potential trend reversal from bearish to bullish. This pattern is considered one of the most reliable technical formations for spotting upcoming upward momentum, particularly after a prolonged downtrend.
🔎 Market Overview
Currency Pair: EUR/GBP
Timeframe: 1-Hour (H1)
Current Price: 0.83720
Trend: Transitioning from a downtrend to a potential bullish breakout
Key Pattern: Inverse Head & Shoulders
Trading Bias: Bullish (Pending breakout confirmation)
📊 Chart Breakdown & Technical Analysis
1️⃣ Market Structure & Trend Analysis
Before the formation of the Inverse Head & Shoulders, the market was in a strong downtrend, making lower highs and lower lows. However, buyers started stepping in near the 0.8350 level, preventing further decline. This rejection at key support has set the stage for a potential trend reversal.
Left Shoulder: Price formed a minor low around 0.8370, followed by a small bounce.
Head: Price made a deeper low around 0.8351, confirming strong support and buyer interest.
Right Shoulder: Price attempted another dip but failed to break below the previous low, forming a higher low near 0.8370, signaling increasing bullish pressure.
Neckline Resistance: 0.8385 - 0.8390 zone – a crucial level that price needs to break for confirmation of an uptrend.
2️⃣ Key Support & Resistance Levels
Support Level: 0.83513 (Major demand zone)
Resistance Levels:
Neckline: 0.8385 - 0.8390 (Breakout confirmation zone)
Major Resistance: 0.84308 (Target level)
Curve Zone: A dynamic resistance trendline that has been containing price action. A breakout above this curve signals a potential shift in trend.
📈 Trading Strategy – Bullish Breakout Plan
✅ Entry Strategy:
A long trade should be considered only after a confirmed breakout above the neckline (0.8385 - 0.8390). The confirmation comes when:
A strong bullish candle closes above the neckline.
Increased trading volume supports the breakout.
A possible retest of the neckline as new support (0.8385) before continuation.
🎯 Target Price & Stop Loss:
Take Profit (TP): 0.84308 (Projected move based on pattern size).
Stop Loss (SL): Below 0.83513 (Right Shoulder low).
Risk-to-Reward Ratio (RRR): 1:2 or higher, making this a high-probability trade setup.
🛑 Risk Management & Trade Confirmation:
Volume Confirmation: A breakout should be accompanied by a volume spike, confirming strong buyer interest.
Fakeout Warning: If price briefly breaks above the neckline but then falls back below, it could be a false breakout. In this case, waiting for a retest would be a safer approach.
Trailing Stop: Once price moves toward 0.8410, a trailing stop can help secure profits in case of market reversals.
🧐 Summary – Key Takeaways
✅ Inverse Head & Shoulders Identified – A reliable bullish reversal pattern.
✅ Breakout Zone: 0.8385 - 0.8390 (Watch for confirmation).
✅ Target Price: 0.84308 (Potential profit zone).
✅ Stop Loss: Below 0.83513 (Protect against downside risk).
✅ Risk-to-Reward Ratio: Favorable (1:2 or better).
✅ Trading Plan: Buy above the neckline, aim for 0.8430, and manage risk properly.
📌 Final Thought: If the neckline is broken with strong momentum, expect a bullish move toward 0.8430+. However, traders should remain cautious of potential fakeouts and manage risk accordingly.
📢 Share your thoughts in the comments! Are you bullish on EUR/GBP? 🚀📊
#EURGBP #ForexTrading #TechnicalAnalysis #TradingSetup #InverseHeadAndShoulders

EUR/GBP - Precision in ChaosPrice action may be wild, but structure is structure—no noise, just levels. The 4H major LH is broken, giving a clear bullish outlook. Liquidity hasn’t been taken yet, nor has order flow fully played out, so the setup is still in motion.
Dropping to the 30M, I spotted a clean OB mitigation, confirming continuation potential. Now, it’s all about execution—on the 5M, I’m waiting for a CHoCH sweep and retrace for my entry. Simple, clean, and calculated.
For clarity, I’ll be showing the 15M chart, and I’ll be posting updates throughout the week to track how the markets play out. Stay tuned—blessings and precision trading ahead.
Bless Trading!


EURGBP is ready to take off ... the week of 07 Apr 2025Weekly chart – strongly bullish, broke above previous structure
Daily chart – strongly bullish, broke above previous structure
H4 chart – bullish, now pulling back towards previous resistance, now turned support.
The formation of a higher low on the daily adds to my confidence that we are headed higher. This is actually a breakout-retest setup. When/If price reaches this zone, I will be monitoring PA on H4 and H1 timeframes with a view to find evidence of a bullish continuation. We could easily have a much deeper retracement too. In the current uncertain world economic situation, it is vital to establish that control of the market has returned to the bulls, before taking a trade.
Stop may be larger than what I would like, but it will need to be below the nearest swing low. Target can be generous too – at 0.8613 or anywhere higher right up to 0.8750.
This is not a trade recommendation; it’s merely my own analysis. Trading carries a high level of risk, only trade with money you can afford to lose and carefully manage your capital and risk.
If you like my idea, please give a “boost” and follow me to get even more. Please comment and share your thoughts too!!
It’s not whether you are right or wrong, but how much money you make when you are right and how much you lose when you are wrong – George Soros

OPPORTUNITY FOR BUY EURGBPWe have the following indicators for a BUY opportunity:
• Low volume suggesting continuation of the current direction.
• Support at a monthly low level.
• Re-test 6M low + 3M low
• Reflection from the bottom of the parallel channel.
• Strong long-term support area.
• Bounce from the trend line.
We define 3 goals:
TP 1 = 40 pips
TP 2 = 100 pips
TP 3 = 200 pips
SL = -200 pips

EURGBP Wave Analysis – 4 April 2025
- EURGBP broke resistance area
- Likely to rise to resistance level 0.8500
EURGBP currency pair recently broke the resistance area located between the resistance level 0.8450 (which has been reversing the price from September), resistance trendline of the daily down channel from November and the 50% Fibonacci correction of the downward impulse from March.
The breakout of this resistance area should strengthen the bullish pressure on this currency pair.
EURGBP currency pair can be expected to rise to the next resistance level 0.8500 (former yearly low from 2023 and strong support from the start of 2024).

EURGBP- Chart of the day (Trend line break out)The pair hits a fresh year high on board-based Euro buying. Intraday bias remains bullish as long as support 0.8380 holds. It hit an intraday high of 0.85014 and is currently trading around 0.85008.
Technical Analysis
The pair is currently trading above the 34- and below 55-EMA on the 4-hour chart.
Bearish Trend Confirmation: Any break below 0.84500 confirms an intraday bearish trend. A drop to 0.8400/0.8380/0.8300 is likely.
Near-Term Resistance: It broke major trend line resistance (trend line joining 0.87564 and 0.86251). A jump to 0.85405 (200 W EMA)/0.8600 is possible.
Indicator Analysis (Daily chart)
CCI (50): Bullish
Average Directional Movement Index: Bullish
Trading Recommendation
It is good to buy on dips around 0.84950-98 with SL around 0.84480 for a TP of0.8600

EURGBP Market Structure Analysis on 4 Hour Timeframe4H swing is bullish => current is pullback
M15 swing is bearish.
Currently giving CHoCH reversal signal.
We can look for buying opportunities in this area.
More carefully, we wait for the price to break the top to confirm the 15-minute reversal frame.

possibility of uptrendIt is expected that the upward trend will continue and continue until the specified resistance levels.
Otherwise, the corrective trend will form until the specified support level and then the continuation of the upward trend will be likely.

EURGBP Poised for Upward Momentum - Buy Opportunity AheadEURGBP is signaling a bullish scenario according to the EASY Trading AI strategy. Current analysis indicates a strategic entry at 0.84329, aiming for a clear upward potential with a well-defined take profit target at 0.84801333 and protective stop loss level at 0.83535333. The EASY Trading AI identifies this move based on emerging bullish market structure, steady price momentum, and supportive buying volumes at current price levels. Watch for continued buyer strength confirming this anticipated move towards our established upside target.

EURGBP BUY BIASHere is a follow up on this markup. Additional confluences was used to pick this trade.
1) 61.8 Fib Level
2) Pivot Level
3) Formation of Right shoulder
Note: Markups here are for educational purposes to help support you guys more.
