EUR/JPY bullish This trading idea focuses on the EUR/JPY currency pair on a 45-minute timeframe. The chart highlights several key elements:
Support Level: Identified at approximately 159.887, marked by a purple horizontal line. This level has shown historical significance, providing a potential area for price bounce.
Ascending Trendline: Starting from the low in mid-December, delineated by a blue line. This trendline indicates a bullish trend, suggesting potential upward momentum.
Buy Zone: A green rectangle marks this zone, with the top at 162.014 and the bottom aligning with the support level. This area is identified as a potential entry point for long positions.
Stop-Loss Zone: Highlighted by a red rectangle below the support level, extending down to 159.149. This zone is suggested for stop-loss placement to mitigate potential losses.
The idea is to capitalize on the expected bounce off the support level, targeting a price around 162.014 while managing risk with a stop-loss below 159.887.
EURJPY.100.MINI trade ideas

IDEA EURJPY SHORT POSITION Hi Traders
Pair: EURJPY
📈 Position: SHORT ( SELL )
✅ Entry: 161.500
🛑 SL: 161.850
🎯 Take Profits:
• TP 1: 161.150
• TP 2: 160.800
• TP 3: 160.450 (Trailing SL)

#005 EURJPY Short 60SMA Pullback Overbought 20,1,1EURJPY 15 Minutes Short when price pulled back to 60SMA plus overbought 20,1,1.
Previous price action has also shown similar trend continuations. So...
WIll be back in a few hours, 15 Minutes Time Frame allows more time for us to react, around 6 hours on average I feel would be a good time to come back and check the charts if we enter during london session.
For 1 Minute Time Frame, I think 1 Hour or so would be a good time for us to come back to check the charts and decide if we would want to exit manually or not.
Just focus on being an executioner wielding your executioner's sword. You are just a part of the supply chain. Do your part, and leave the rest to others. Payouts, profit and loss is the duty of the finance department, you as the executioner, is one of the last part of the supply chain. Just do your part.
Get instructions from the judge to begin the execution process. Checking of identity of the guilty, double confirming of punishment, and then execution of punishment. That's all. The collection of bodies, the undertaker's job. guilty's family after care, social workers job. If the loss an income source, the social workers and career coach's job. Guilty's family health issues, doctors and nurses job.
You get it.
1604SGT 21012025

EURJPY LongHi Everyone,
Hope you're ok. Here is our signal for EURJPY. I hope that it brings profit for you all.
We want the 15 minute candle to close above the entry, and then respect the entry. Then we will enter.
RiskReward is essential. If you are blowing an account, only once, you are doing something wrong. Probably your lot size is too big. Take the time to learn.
EURJPY Buy 🦇
📈Entry: 162.160
⚠️SL: 160.435
✔️TP1: 163.899
✔️TP2: 165.902
✔️TP3: 168.548
Happy trading hope you all make lovely profit. Drop me a like if you do.
Best wishes

DeGRAM | EURJPY rebound from the trend lineEURJPY is in a descending channel between the trend lines.
The chart has formed a harmonic pattern.
The price is moving from the lower boundary of the channel and dynamic support.
We expect a rebound.
-------------------
Share your opinion in the comments, and support the idea with a like. Thanks for your support!

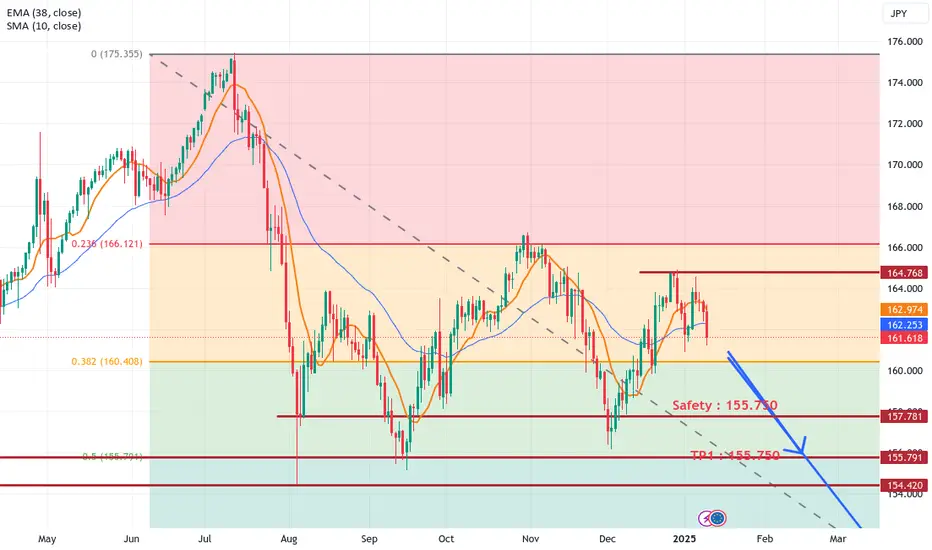
[EURJPY] - Technical Forecast (SELL) TP : 157.781Hello Guys, Long time no see.
How's your trading ? I hope you make a lot of profit as well 2025.
Please, review my analysis and start trading together!!
Good Luck!
Best Sell Entry Range : 161.747-164.434
TP1 : 155.750 (Safety : 157.781)
TP2 : 151.300
SL : 164.768
EURJPY High Probability Trade Setup (Sell Plan)ICMARKETS:EURJPY
🔹 161.90 - 162.20 (Ideal Reversal Zone After Stop Hunt Above 162.00)
🔹 Stop Loss (SL): Above 162.60 (Protecting against liquidity grab)
🔹 Take Profit 1 (TP1): 160.50 (Demand Zone)
🔹 Take Profit 2 (TP2): 159.50 (Full Target, Swing Low Liquidity)
🔥 What’s Next?
Confirmation Needed: If price rejects 162.00-162.20 with a strong H4 bearish engulfing or wick rejection, execute the short.
Watch 161.50: If price starts holding above 161.50 after a pullback, this could indicate bullish continuation instead.
EURJPY TRADE EXECUTION PLAN – CLARITY
We are waiting for EITHER of the two conditions for short entry:
✅ BREAK & RETEST (Higher Confirmation)
1️⃣ Price breaks below 161.60-50 with a strong bearish candle.
2️⃣ Price retests 161.60-50 as resistance (previous support flips).
3️⃣ Rejection confirmation on lower timeframes (H1) → Enter short.
📌 Why?
This gives extra confirmation that sellers are in control.
Reduces the chance of false breakdowns or liquidity grabs.

EURJPY - Short from bearish OB !!Hello traders!
‼️ This is my perspective on EURJPY.
Technical analysis: Here we are in a bearish market structure from 4H timeframe perspective, so I look for a short. I want price to go a little bit higher to fulfill the imbalance and then to reject from bearish OB.
Fundamental news: On Friday (GMT+2) we will see results of Interest Rate in Japan, news with high impact on currency.
Like, comment and subscribe to be in touch with my content!

eurjpy transaction in 15 minutesDue to the sharp increase in the price, we will make corrections
ENTRY:161.370_161.480
SL:161.618
TP:160.595
***If you trade, be sure to follow capital management***
***Please comment your opinion, it is important to me***

EUR/JPY ANALYSIS LOOK HEREThis is eur/jpy analysis,market overall is downside trend because price is breaking market structure to the downside,so we're looking for sell opportunity at the moment price is heading toward supply zone a good area to sell eur/jpy also there is fair value gap near the supply zone.before enter a trade wait for the change of character to happen in 1 hour or 30 min.wait till fair value gap be filled.trade safe

EUR/JPY Long/Short Scenarios and Chart AnalysisChart Feedback(Daily Chart)
1. Price has been oscillating within September Low and late Oct. High for some time now.
2. Current price level at minor support level
3. EMA's 21,100 have been crossed from above suggesting price might continue to fall
4. A triangle between Main and the Sub trend is closing making the price moves tighter
5. Head and Shoulders is forming
Important Levels to watch:
164.525 Last week high which is also last resistance zone
161.250 Last Low
Trend Scenarios
S1 Long. Rejection from current area, the move up will be difficult as there are couple of resistance levels very close to each other.
S2 Short. Bearish momentum continues and good space to move, I would expect support at 159.878 and 157.843 so entering in rallies wouldn't be a bad idea.
Trade Ideas(4 Hour Chart)
S1 Long. To trigger a long trade I want to see a break and retest at the current level 162.000, EMA's cross, Current Trend line cross, and bullish candle sticks.
Target 1 164.528,
Target 2 166.000
S2 Short For short positions I will only look for break and re-test of the current level as the rest of the signals (For Me) are all set up for sell.
Target 1 160.000
Target 2 158.850
I hope there was anything useful for any of you!
Trade mindfully

EUR/JPY Analysis:Bearish Insights Using MMXMIn this analysis, I explain why I'm bearish on EUR/JPY, marking my key levels with the MMXM strategy. I've also outlined the reasons for a possible bullish perspective, but my short-term stance remains bearish. Please note, this is not financial advice—it's my personal view based on my chart analysis. If you're interested, trade responsibly and always do your own research!

EURJPY BULLISHNESS?"EUR/JPY shows potential for a temporary upward move. Further confirmation in the new week will be key to determining the strength of its bullish momentum. Stay patient and analyze carefully! 📈✨ #ForexTrading #EURJPY"

EURJPYTrying out this strategy. Price is currently trading around the uptrend line where a bounce off is expected to liftoff to the downtrend line. Let’s see how it plays out. Just for the journals
Stop loss can be adjusted at 159.732 for a bit room

EURJPY LongAfter respecting the higher timeframe trendline and support area price broke structure and previous resistance zone while respecting the fib. waiting for more lower timeframe structure to print before entering

EURJPY SHORTFrom the H4 chart we can see price isn't going upwards but downwards. Now there's a new low created and the hall Mark of a downtrend is the ability of the market to create lower lows and lower highs. Fibonacci levels are in place, if price gets to the 50 and 61.8 levels I'll be waiting on a Bearish reversal candle stick pattern as my signal to sell.
Risk will be 0.5% and targets around 1% of my account

EURJPY BEST AREA FOR SELL* Market left below equal liquidity in day time frame
* market is bearish in 4hr time frame
* create a BPR in 4hr
* take sell after confirmation in lower time frame 15min

EURJPYEUR/JPY represents the exchange rate between the euro (EUR) and the Japanese yen (JPY). It shows how many Japanese yen are needed to buy one euro. This pair reflects the economic relationship between the Eurozone and Japan.
The exchange rate is influenced by factors such as monetary policies of the European Central Bank (ECB) and the Bank of Japan (BoJ), interest rate differentials, inflation data, and global economic conditions. The BoJ often maintains low or negative interest rates, which can weaken the yen against the euro.
EUR/JPY is popular among traders for its volatility and liquidity. It is often used to gauge risk sentiment, as the yen is considered a safe-haven currency during market uncertainty.

EURJPY - ShortEURJPY Analysis - SELL 👆
In this Chart EURJPY H3 Timeframe: By Nii_Billions.
❤️This Chart is for EURJPY market analysis.
❤️Entry, SL, and Target is based off our Strategy.
This chart analysis uses multiple timeframes to analyze the market and to help see the bigger picture on the charts.
The strategy uses technical and fundamental factors, and market sentiment to predict a BEARISH trend in EURJPY, with well-defined entry, stop loss, and take profit levels for risk management.
🟢This idea is purely for educational purposes.🟢
❤️Please, support our work with like & comment!❤️

EURJPY 100-300 pips potential sell signal Our previous trade on this pair was 100+ pips successfully
We plan to sell around 160.60, as we see signs of a double top on the 4-hour chart and a continuing downtrend. Although a small bounce or correction may occur, we expect gains to be limited due to Ichimoku cloud resistance.
If the price breaks below 159.57, which is our initial target, we see further downside toward 156.80, offering a potential move of about 400 pips. Fundamentally, the possibility of a Bank of Japan rate hike supports the idea of Japanese Yen strength, adding more weight to a downward move in EUR/JPY.
Key Support Levels:
159.57
156.80

eurjpy buy tradeThe Relative Strength Index (RSI) is showing an upward trend, indicating increasing momentum. Additionally, the Moving Average Convergence Divergence (MACD) is showing a bullish crossover, further supporting the potential for an upward move

EURJPY | 17.01.2025BUY 160.050 | STOP 159.400 | TAKE 160.800 | On the chart, the instrument continues to move downwards; we expect short-term corrective growth from local support line to the area of 160.800.

Triangle pattern We have a triangle pattern followed by a breakout and a deep pullback, now as the price is set to make a lower low, we can enter the market and place our stoploss at the 4hour 20MA
WE ONLY TRADE PULLBACKS
