EURJPY - BearishEURJOY is in bearisj trend and retracing from Fib 0.618 level which is also in confluence with trendline resistance. Take Short position at current price.
EURJPY.100.MINI trade ideas

EURJPY SELL IDEAOANDA:EURJPY
Overall bias on EURJPY is bearish, thus I am looking for sells. Price just made a retest at the Daily AOI, and what I am looking for next is a bearish engulfing candlestick on the 4H timeframe to go short on this pair

EURJPY → Consolidating before dropping to 157.00OANDA:EURJPY is under pressure. This currency pair has broken its local uptrend. In the context of weak fundamental and technical foundations, overall market pressure may be experienced.
On the global timeframe, the pair lacks a clear trend and has been trading mainly within the range of 166 - 156. A closer look reveals that the recent growth attempt failed near the intermediate high. As the price approached a local resistance level, it reversed and stabilized below the EMA, moving toward the lower boundary of the flat range.
Locally, a structural shift has confirmed the bearish nature of the market. However, before further declines, the price may form a corrective move. Using Fibonacci levels to measure this potential correction, the short-term levels to watch are 0.618 (161.75) and 0.5 (162.28). In the medium term, however, the decline may continue.
Rate, share your opinion and questions, let's discuss what's going on with OANDA:EURJPY :)
Regards R. Linda!

EurJpy Trade IdeaWith EJ respecting a support level and shifting structures on the smaller time frame I've decided to get into some longs for a 1:3rr with stops just below structure. If all goes well and price respects the shift at the level then we could expect bullish structures to continue running from here. We may see a range continuation between 161.445 and 164.424

EURJPY – Potential Buy Opportunity at Support LevelThe EURJPY pair is trading near a key demand zone which has acted as strong support during previous price actions. This area has historically attracted buyers, making it a significant zone for potential bullish reversals.
The recent bearish momentum has brought the price into this demand zone. If bullish confirmation appears, such as candlestick reversal patterns (e.g., bullish engulfing or long lower wicks), the price could see a recovery. A potential target for this bounce would be the 161.654 level, which represents a logical target for this setup.
Do you see this playing out, or would you approach it differently? Share your thoughts and analysis in the comments below!

EURJPY | 13.01.2025BUY 160.800 | STOP 160.250 | TAKE 161.450 | Correction moving from support range.

EURJPY ANALYSISAfter seeing a bearish push last week on this pair, we could expect price to continue that momentum and seeing the 4hr structure making LL and LH as confirmation.

POSSIBLE SELL OUT LOOK ON EURJPYPrice has broken the trend on 4hr time fame with a series of highs and lows on EJ .Hence we have gotten the first and second touch of the new down trend .we are patiently waiting for the third touch and a clear rejection candle to join the sells.

eurjpy buy signal. Don't forget about stop-loss.
Write in the comments all your questions and instruments analysis of which you want to see.
Friends, push the like button, write a comment, and share with your mates - that would be the best THANK YOU.
P.S. I personally will open entry if the price will show it according to my strategy.
Always make your analysis before a trade

Bearish drop?EUR/JPY is reacting off the pivot and could potentially drop to the 1st support.
Pivot: 161.39
1st Support: 157.91
1st Resistance: 165.23
Risk Warning:
Trading Forex and CFDs carries a high level of risk to your capital and you should only trade with money you can afford to lose. Trading Forex and CFDs may not be suitable for all investors, so please ensure that you fully understand the risks involved and seek independent advice if necessary.
Disclaimer:
The above opinions given constitute general market commentary, and do not constitute the opinion or advice of IC Markets or any form of personal or investment advice.
Any opinions, news, research, analyses, prices, other information, or links to third-party sites contained on this website are provided on an "as-is" basis, are intended only to be informative, is not an advice nor a recommendation, nor research, or a record of our trading prices, or an offer of, or solicitation for a transaction in any financial instrument and thus should not be treated as such. The information provided does not involve any specific investment objectives, financial situation and needs of any specific person who may receive it. Please be aware, that past performance is not a reliable indicator of future performance and/or results. Past Performance or Forward-looking scenarios based upon the reasonable beliefs of the third-party provider are not a guarantee of future performance. Actual results may differ materially from those anticipated in forward-looking or past performance statements. IC Markets makes no representation or warranty and assumes no liability as to the accuracy or completeness of the information provided, nor any loss arising from any investment based on a recommendation, forecast or any information supplied by any third-party.

Trading in 15 minutesIn order not to lose the transaction, you can enter at the point 161.635 and if the price goes higher, you can also add in the areas 162.370-163.800.
ENTRY1:161.635
ENTRY2:162.370_163.800
SL:164.620
TP:158.650

A short sell on EURJPYOn the monthly timeframe, EUR JPY is bullish as the previous low at 154.414 did not break the last low. Therefore we expect a bullish continuation to the previous high indicated around 175.348. However, this sell analysis focuses on a catching a short sell setup within this bullish monthly structure on the 1D timeframe, before prices goes back to the last high.
If this sell setup holds, areas of interest include
Entry: 165.596
Target: 156.160
Stop Loss: 167.664

EURJPYBearish divergence at top beark last HL my entry at last ressistance entry type is limit.
Entry price 162.735
Stop loss 164.100
TP1 161.380
TP2 159.986
RRR 1:2

EURJPY Massive Short! SELL!
My dear subscribers,
My technical analysis for EURJPY is below:
The price is coiling around a solid key level - 163.75
Bias - Bearish
Technical Indicators: Pivot Points High anticipates a potential price reversal.
Super trend shows a clear sell, giving a perfect indicators' convergence.
Goal - 162.82
About Used Indicators:
By the very nature of the supertrend indicator, it offers firm support and resistance levels for traders to enter and exit trades. Additionally, it also provides signals for setting stop losses
———————————
WISH YOU ALL LUCK

My system is giving me a long tradeMy system is giving me a long trade.
When/if my 1st target is hit, i will then move my stops to breakeven. Risk only max 2%

EUR/JPY Short Setup: Price Action & Market Structure Confluence This trade setup is based on a confluence of key price action and market structure levels, with a focus on key support/resistance areas, price reactions, and trend confirmation across multiple timeframes.


EUR/JPY 4H: Key Fibonacci and Volume Profile LevelsOANDA:EURJPY EUR/JPY 4H: Key Fibonacci and Volume Profile Levels
Analysis:
Description:
The chart displays the EUR/JPY currency pair on a 4-hour timeframe. It includes several key indicators and annotations such as Break of Structure (BOS), Change of Character (ChoCH), Fibonacci retracement levels, and volume profile. The RSI indicator is also shown at the bottom of the chart.
Analysis:
Price Action and SMC Analysis:
Break of Structure (BOS): Multiple BOS points are marked, indicating significant shifts in market structure.
Change of Character (ChoCH): These points suggest potential reversals or shifts in market sentiment.
Fibonacci Retracement Levels: Key levels at 0.382 (163.34288), 0.5 (162.977), 0.618 (162.59712), 0.705 (162.3222), and 0.786 (162.06624) are plotted, indicating potential support and resistance zones.
Volume Profile: High volume nodes at 163.612, 163.208, and 160.897 suggest strong interest and potential areas of price reaction.
RSI Analysis:
The RSI is currently around 46.42, indicating a neutral to slightly bearish momentum. The RSI has previously shown oversold conditions, suggesting potential buying opportunities.
Buy Strategy
Entry: Consider entering a long position at the 0.618 Fibonacci level (162.59712) as it aligns with a high volume node and potential support.
Take Profit 1 (TP1): 163.208 (61 pips)
Take Profit 2 (TP2):: 163.612 (101 pips)
Stop Loss (SL): 162.06624 (53 pips)
Sell Strategy
Entry: Consider entering a short position if the price breaks below the 0.786 Fibonacci level (162.06624) with confirmation.
Take Profit 1 (TP1): 161.500 (56 pips)
Take Profit 2 (TP2):: 160.897 (117 pips)
Stop Loss (SL): 162.59712 (53 pips)
VIP Signal
Buy Signal: Entry: 162.59712 TP1: 163.208 (61 pips) TP2: 163.612 (101 pips) SL: 162.06624 (53 pips)
Sell Signal: Entry: 162.06624 TP1: 161.500 (56 pips) TP2: 160.897 (117 pips) SL: 162.59712 (53 pips)
Follow @Alexgoldhunter for more strategic ideas and minds
This comprehensive analysis leverages Price Action, Smart Money Concepts (SMC), and ICT Elliott Wave strategies to provide detailed buy and sell strategies. The Fibonacci retracement levels, volume profile, and RSI indicators highlight key areas of interest for optimal trading decisions.

eurjpy buy signal. Don't forget about stop-loss.
Write in the comments all your questions and instruments analysis of which you want to see.
Friends, push the like button, write a comment, and share with your mates - that would be the best THANK YOU.
P.S. I personally will open entry if the price will show it according to my strategy.
Always make your analysis before a trade

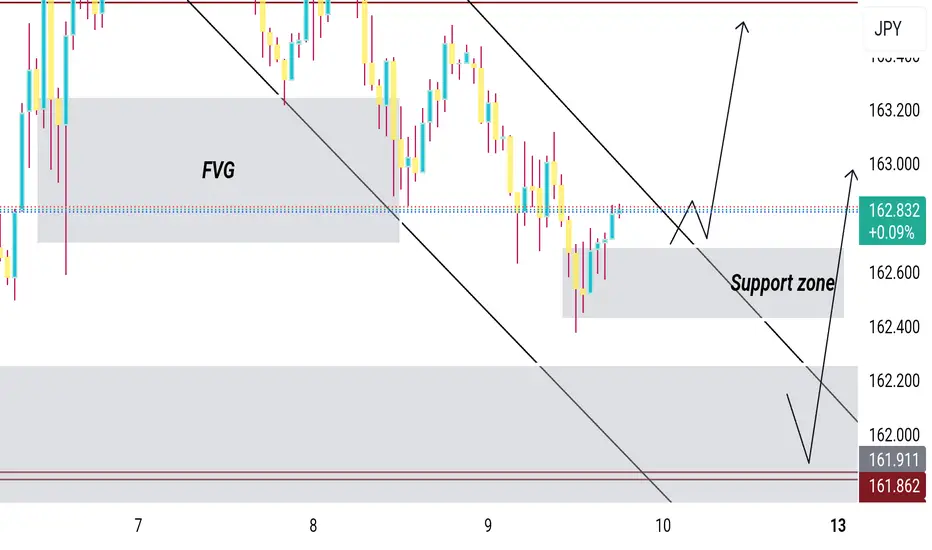
EURJPY BUY ZONE Hey there on 1HTF EURJPY for technically seems bullish target 163.500
1. Vertical support line from 162.500
2. Further buy support zone 162.00
For now we can seems like our buy support zone 162.500 and our next target
163.200
163.500
163.800
Good luck
EURJPY Sell ForecastEURJPY New forecast👨💻👨💻
Note:
Follow proper risk management rules. Never risk more then 2% of your total capital. Money management is the key of success in this business...... Set your own SL & TP.
Please support this idea with a Like and COMMENT if you find it useful click "follow" on our profile if you will like these type of trading ideas delivered straight to your email in the future.
Thanks for your continued support!! lemme know your thoughts in the comment sec...

EURJPYEURJPY IS bullish and will always be that way for now, but the pairs are seeing weekly correction and we all need be careful of bank of japan monitory policy change which can flip all bullish gains against japanase yen

eurjpy on ob way to havenFrom the image, here’s a breakdown of EUR/JPY based on the visible **Order Blocks (OB)** and the ICT framework:
1. **Bullish Market Structure**:
- The chart indicates a **bullish bias**, as price has been reacting to daily order blocks (d OB) and respecting them as demand zones. The structure is stepping higher, with price reaching for liquidity above.
2. **Key Order Blocks**:
- **Daily OBs** (d OB) are clearly marked and have acted as support during retracements.
- The **weekly OB** (w OB) at the lower levels is a significant demand area, but price is far from it, indicating a focus on higher targets.
3. **SMT Divergence**:
- A divergence (SMT) is plotted on the chart, potentially signaling a reversal from the lows in line with the bullish order flow.
4. **Target Zones ("Haven")**:
- The **Buy Side Liquidity (BSL)** is marked near **166.694**. Price is likely aiming for this level, which aligns with a higher timeframe objective.
5. **Expectations**:
- Price could react to the nearest d OB, consolidate or pull back, and then continue its bullish trajectory toward the liquidity resting above.
- A break below the most recent d OB would shift the focus to deeper retracements, potentially targeting another d OB or the w OB below.
