EUR_USD LOCAL LONG|
✅EUR_USD is going down to retest a horizontal support of 1.0430
Which makes me locally bullish biased
And I think that we will see a rebound
And a move up from the level
Towards the target above at 1.0479
LONG🚀
✅Like and subscribe to never miss a new idea!✅
EURUSD_TOM trade ideas


Hellena | EUR/USD (4H): LONG resistance area 1.05281 (Wave 3).Colleagues, price has traveled a long distance and this could mean that price is moving in impulse. This means that the price is in wave “1” and now a correction is expected in wave ‘2’ (50% Fibonacci level 1.03264) and then I expect the upward movement to continue in wave “3” which will reach the resistance area 1.05281.
Manage your capital correctly and competently! Only enter trades based on reliable patterns!

EUR/USD: Dollar Surges,Technical Indicators Point to ReversalThe EUR/USD currency pair is showing a clear downward trend today, retreating from Friday's brief rally that saw it briefly touch the 1.051 level. Currently hovering around 1.0448, the pair's weakness is fueled by a slightly resurgent US Dollar. Buoying the greenback are climbing US government yields; the 10-year Treasury note, for instance, has risen to 4.51%, an increase of 4 basis points. However, the positive sentiment pervading global stock markets is acting as a counterweight, tempering the USD's potential for significant gains.
Analyzing the technical landscape, the price action appears to be hitting a critical juncture. The current trading range is approaching a clearly defined resistance zone, which also presents as a supply area. Compellingly, insights gleaned from the Commitments of Traders (COT) report reveal that retail traders hold a significant long position within this area. This, combined with a potential bearish seasonal trend, adds further weight to the possibility of a downward reversal.
Based on this confluence of technical indicators, we are actively watching for a potential price reversal within the identified resistance zone. The interplay of market forces and trader positioning suggests a bearish outlook for the EUR/USD pair in the near term.
✅ Please share your thoughts about EUR/USD in the comments section below and HIT LIKE if you appreciate my analysis. Don't forget to FOLLOW ME; you will help us a lot with this small contribution.

Elliott Wave View: EURUSD Looking to Extend Higher in 5 WavesShort term Elliott Wave in EURUSD suggests rally from 1.13.2025 low is unfolding as a zigzag structure. Up from 1.13.2025 low, wave A ended at 1.0533 and pullback in wave B ended at 1.021. Wave C higher is in progress with internal subdivision as a 5 waves. Up from wave B, wave (i) ended at 1.035 and pullback in wave (ii) ended at 1.0269. Wave (iii) higher ended at 1.043 and pullback in wave (iv) ended at 1.0399. Wave (v) higher ended at 1.0442 which completed wave ((i)) in higher degree.
Pullback in wave ((ii)) unfolded as a zigzag structure. Down from wave ((i)), wave (a) ended at 1.035 and wave (b) rally ended at 1.041. Wave (c) lower ended at 1.0278 which completed wave ((ii)) in higher degree. Pair has resumed higher in wave ((iii)). Up from wave ((ii)), wave (i) ended at 1.0385 and pullback in wave (ii) ended at 1.031. Wave (iii) higher ended at 1.0514. Expect dips in wave (iv) to correct cycle from 2.12.2025 low before it resumes higher. Near term, as far as pivot at 1.0204 low stays intact, expect dips to find support in 3, 7, 11 swing for further upside.

EURUSDHello friends🌹
The trend on higher time frames is completely bullish
Enter long positions with personal confirmation and strategy!💎
Analysis is useless without personal confirmation.✔

EUR/USD: Pivotal Week AheadHello,
FX:EURUSD faces a busy week ahead with several key events: the upcoming German elections, US CPI data, German GDP news, and an ECB speech by Schnabel. If the price follows the current trend, we could see further gains. Conversely, if conditions worsen, a reversal is possible. Despite occasional setbacks, the euro is steadily gaining strength over the long term. For the euro to reach 1.12, the one-year pivot point needs to act as support; if it instead becomes resistance, the pair could see significant downside, potentially testing the 0.98692 level.
The support (green) and resistance (red) levels shown represent the current key zones for this pair across timeframes from 1 day to 1 year.
No Nonsense. Just Really Good Market Insights. Leave a Boost
TradeWithTheTrend3344

EURUSD / LONG / 19.02.25⬆️ BUY EUR/USD 19.02.25
💰 Entry: $1.04324
🎯 Goal: $1.05333
⛔️ Stop: $1.04190
Entry reasons:
1) OSOK:
— Week minimum was set on tuesday and price is moving to weekly open level with 15m bullish structure.
— Month minimum was set at the first weekly of month and price is above monthly open level.
2) Eliott waves:
— 1D: ABCDE
— 4H: 1-2, wave 3 is forming.
3) Range:
— Price is inside bullish weekly range
— Price is inside bullish daily range (correction, 38-50%)
4) Addition arguments:
— Testing of big cluster
— Divergence (1h)
— Downtrend is not confirmed by volumes (low effort and result).
Therefore, it's manipulate to create swing point on wednesday.
Goal is previous weekly high: $1.05333

BullishAfter a short pullback, bearish is time to market to push to the new HH, and now we are in a small pullback, again befor the BOS, of the previus HH

EUR/USD - Ready for a Massive Breakout?The EUR/USD pair is currently respecting a well-defined ascending channel, displaying clear bullish market structure with higher highs and higher lows. After testing the bottom of the channel three times, price has only made higher lows, indicating a shift in momentum and a strong demand zone. This suggests that buyers are stepping in aggressively at lower levels, reinforcing the bullish outlook.
🔹 Key Levels & Observations 🔹
🔸 Fair Value Gap (FVG) as Strong Support.
One of the most significant technical factors in this setup is the fair value gap (FVG), which has consistently acted as a strong support level. Price has been creating higher highs after bouncing from this zone, making it a crucial area of interest. This FVG has been filled, and price is showing signs of respecting it, further solidifying the bullish sentiment.
🔸 Bottom of the Channel Successfully Defended.
The market has tested the bottom of the ascending channel three times, and after each test, price has only made higher lows. This kind of price action is a strong indication that buyers are in control, absorbing selling pressure and pushing price higher.
🔸 Strong Resistance at the top.
The black horizontal resistance line represents a key level where price has struggled to break above in the past. It has been tested multiple times, confirming its significance. A clean breakout above this level would serve as confirmation that bulls have full control, potentially leading to a strong continuation to the upside.
🔸 Bullish Structure Confirmed?
As price continues forming higher highs and higher lows, the overall market structure remains bullish. As long as price respects the fair value gap and the ascending channel, the expectation is for a continuation of the uptrend.
📌 Trading Plan & Potential Scenarios 📌
✅ Bullish Scenario:
If price holds above the fair value gap (green support zone) and continues to form higher lows, the bias remains bullish.
A break and close above the strong resistance level (black line) would be the ideal confirmation for further upside movement.
If a breakout occurs, we could see a strong rally as trapped sellers get liquidated and momentum builds.
❌ Bearish Scenario (Invalidation Level):
If price fails to hold the FVG support zone and starts forming lower highs, we may see a deeper correction towards the lower boundary of the channel.
A confirmed break below the channel could signal a trend reversal.
📉 What to Watch for Confirmation 📈
🔹 Break and close above the strong resistance (black line) for a bullish breakout confirmation.
🔹 Continuation of higher lows & higher highs within the ascending channel.
🔹 Strong buying pressure at the fair value gap to maintain the bullish bias.
Final Thoughts:
At this stage, the EUR/USD pair is looking bullish, with the market structure aligning with a continued upward move. The fair value gap is a key support level, and as long as price holds above it, the trend remains intact. A breakout above resistance could signal a strong move to the upside, potentially triggering more buying interest.
What are your thoughts on this setup? Do you think we’ll see a breakout above resistance soon? Let me know in the comments! 🚀📈
__________________________________________
Thanks for your support!
If you found this idea helpful or learned something new, drop a like 👍 and leave a comment—I’d love to hear your thoughts! 🚀
Make sure to follow me for more price action insights, free indicators, and trading strategies. Let’s grow and trade smarter together! 📈✨

EURUSDWhat you can see based on my analysis Is that price is in a down strong down trend and is also in a demand zone that has now turned into a support Level, and that support / Demand Zone happens to be around a Psychological Level

EURUSD - BULLISH MOVE "Demand Zone Reaction"DXY IS BEARISH, as EUR is currently at a critical decision point—either confirming a bullish reversal from the demand zone or continuing the downtrend.
Entry: Looking for bullish confirmation within the Demand Zone (1.03602 region).
🔹 Stop Loss (SL): Below the Demand Zone at 1.02006.
🔹 Take Profit (TP):
TP1: FVG Midpoint (1.04500)
TP2: Daily Resistance Level (1.05000)
TP3: Full Liquidity Grab (1.06500+)
🔹 Risk-to-Reward (R:R) Ratio: 4R+ potential.
🔎 Trade Confirmation Criteria
✅ Bullish rejection wicks or engulfing candles in the demand zone.
✅ Liquidity sweep followed by a strong move up.
✅ Market structure shift to bullish on lower timeframes.
❌ Invalidation
If price fails to hold the demand zone and breaks below 1.02006, it signals further downside, invalidating the trade idea.
🚨 Disclaimer: This is not financial advice. Always conduct your own research and risk management before entering trades.
🔔 What’s your bias? Are you looking to enter long or waiting for further confirmations? Drop your thoughts below! 🚀

EURUSD Sell Trade Idea📉 EURUSD Sell Trade Idea 📉
Looking for a move lower as price tests resistance and starts rejecting. Targeting 1.0466 - 1.0462 for a potential drop.
🔹 Current Price: 1.0474
🔹 Target 1: 1.0466
🔹 Target 2: 1.0462
🔹 Deadline: Feb 25, 10:00 UTC
This is the direction—now it’s up to you to implement your own strategy for entries. Stick to your plan and manage risk! 🔥
Drop your thoughts below! 👇🏼
#EURUSD #ForexTrading #TechnicalAnalysis #PriceAction #TradeSetup #MarketMoves #ForexStrategy

EURUSD H4 BEARISHFX:EURUSD Eurusd has got Rising Wadge pattern on H4 time frame which shows bearish as per my analysis it is bearish and on downside we consider sell.... PIPS FLOW TECHNOLOGIES

EURUSD - THE FINAL BATTLEEURUSD - U.S. Dollar the last 30 days is the weakest of all the major players in the market. Euro for long time is behind the U.S Dollar as the second weak player. The price is right now at very strong supply zone and next days it is possible to see two scenarios. Fist scenario is Euro continue the bull run and price either hit the trend line or reject the last supply zone and move higher. The second scenario is U.S Dollar respect the last supply zone break the last bull trend line and moving lower and Euro become the weakest of the market.

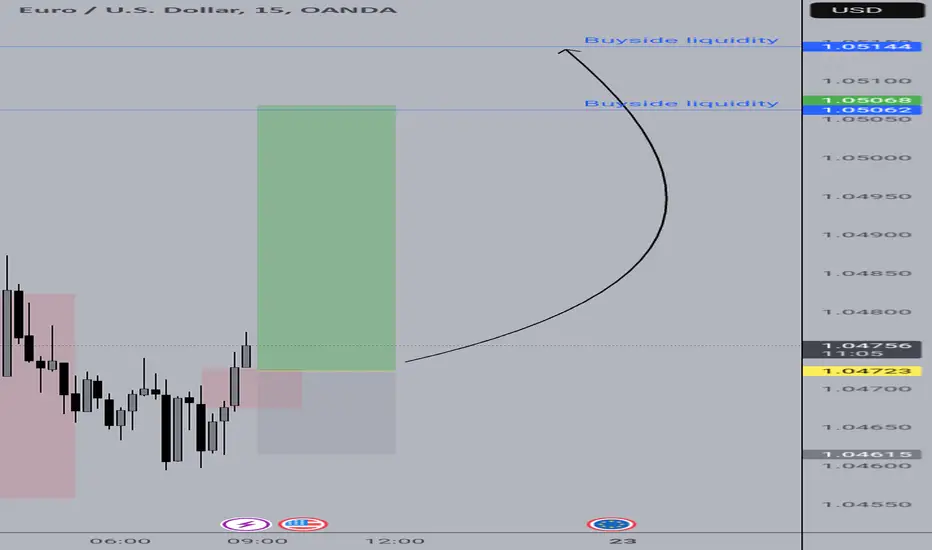
Buyside Liquidity in viewWe've had an impulsive market structure shift inside a 4 hour fair value gap. Now we target buyside liquidity for a 1:3R move
Intraday EURUSD short Price recently rejecting off 4hr resistance level with short term 30min downtrend forming.
Price currently rejecting off 30min downtrend line, resistance and fib retracement.
entry on break out counter trend channel and support level
Stop loss behind recent swing high
Target at 30min channel and MPO taken from 5min counter trend channel break
Inline with ECB (cutting) and FED (holding) divergence

EUR/USD NEXT MOVESell after bearish candle stick pattern, buy after bullish candle stick pattern....
Best bullish pattern , engulfing candle or green hammer
Best bearish pattern , engulfing candle or red shooting star
NOTE: IF YOU CAN'T SEE ANY OF TOP PATTERN IN THE ZONE DO NOT ENTER
Stop lost before pattern
R/R %1/%3
Trade in 5 Min Timeframe, use signals for scalping

Harmonic Pattern Trading: Ultimate Guide for 2025Harmonic trading is a powerful price action-based strategy that uses Fibonacci ratios to identify high-probability reversal zones. These patterns fall under XABCD structure, meaning they have five key points (X, A, B, C, and D) and rely on Fibonacci retracements and extensions.
By mastering harmonic trading, you can identify trend reversals early and achieve higher win rates compared to traditional technical analysis methods.
🔹 Key Principles of Harmonic Trading
1️⃣ Structure of Harmonic Patterns (XABCD)
All harmonic patterns follow the same five-point structure:
X → A: The initial move.
A → B: The first retracement.
B → C: A counter move.
C → D: The final leg, forming the Potential Reversal Zone (PRZ).
2️⃣ Fibonacci Ratios in Harmonic Patterns
Harmonic trading is Fibonacci-driven, meaning each pattern is defined by specific retracement and extension levels:
Common Fibonacci Retracements: 38.2%, 50%, 61.8%, 78.6%, 88.6%
Common Fibonacci Extensions: 127.2%, 141.4%, 161.8%, 200%, 224%, 261.8%
3️⃣ Potential Reversal Zone (PRZ)
The D-point of the pattern is where price is expected to reverse.
This PRZ zone is validated by Fibonacci confluence, support/resistance, and other confirmation signals (RSI, MACD, divergence, etc.).
Entry: Around D-point reversal confirmation
Stop Loss: Beyond the PRZ invalidation zone
Take Profit: Based on Fibonacci extension levels (often 61.8%, 100%, or 161.8% retracements).
🔷 Primary Harmonic Patterns & Their Structure
1️⃣ Gartley Pattern 🦋
✅ Most popular & reliable harmonic pattern
✅ Predicts trend continuation or reversal
✅ Respects 61.8% Fibonacci retracement from XA
Gartley Pattern Structure:
AB = 61.8% retracement of XA
BC = 38.2% or 88.6% retracement of AB
CD = 78.6% retracement of XA
D-point PRZ → Strong reversal expected
🚀 Trading Tip: Look for confluence with trendlines, supply-demand zones, and RSI/MACD divergence.
2️⃣ Bat Pattern 🦇
✅ High-probability reversal setup
✅ Stronger deep retracement of XA compared to Gartley
✅ Ideal for trend continuation & reversal trades
Bat Pattern Structure:
AB = 38.2% or 50% retracement of XA
BC = 38.2% or 88.6% retracement of AB
CD = 88.6% retracement of XA
D-point PRZ → Expect strong reversal
🚀 Trading Tip: Bat patterns often provide low-risk entries with tight stop losses due to their deep XA retracement.
3️⃣ Butterfly Pattern 🦋
✅ Predicts deep trend reversals
✅ Used for aggressive counter-trend trades
Butterfly Pattern Structure:
AB = 78.6% retracement of XA
BC = 38.2% or 88.6% retracement of AB
CD = 127.2% or 161.8% extension of XA
D-point PRZ → Strong trend reversal expected
🚀 Trading Tip: Butterfly PRZ zones are more extended, so look for price exhaustion & divergence before entering.
4️⃣ Crab Pattern 🦀
✅ The most extended harmonic pattern
✅ Strong 161.8% XA extension creates powerful reversals
Crab Pattern Structure:
AB = 38.2% or 61.8% retracement of XA
BC = 38.2% or 88.6% retracement of AB
CD = 161.8% extension of XA
D-point PRZ → Extreme overextension, likely strong reversal
🚀 Trading Tip: Use confluence with key support/resistance levels & volume analysis to confirm reversals.
5️⃣ Deep Crab Pattern 🦀
✅ More reliable version of the Crab Pattern
✅ D-point extends further for deeper pullbacks
Deep Crab Pattern Structure:
AB = 38.2% or 61.8% retracement of XA
BC = 38.2% or 88.6% retracement of AB
CD = 224% - 261.8% extension of XA
D-point PRZ → Strong reversal expected
🚀 Trading Tip: Similar to the Crab, but requires stronger confirmation signals before entry.
6️⃣ Cypher Pattern 💠
✅ High accuracy harmonic pattern
✅ Faster entries compared to other patterns
Cypher Pattern Structure:
AB = 38.2% to 61.8% retracement of XA
BC = 127.2% to 141.4% extension of AB
CD = 78.6% retracement of XA
D-point PRZ → Price reversal likely
🚀 Trading Tip: Look for RSI/MACD divergence at the D-point for added confirmation.
7️⃣ Shark Pattern 🦈
✅ Newer harmonic pattern variation
✅ Similar to Crab but uses different Fibonacci rules
Shark Pattern Structure:
AB = 113% - 161.8% extension of XA
BC = 113% - 161.8% extension of AB
CD = 88.6% retracement of XA
D-point PRZ → Strong reversal expected
🚀 Trading Tip: Shark patterns often appear before larger trend reversals, so they work well for early trend detection.
🔷 Advanced Harmonic Patterns Overview
📌 3-Drives Pattern
Predicts the end of trends using 3 equal price movements
Each drive follows Fibonacci retracements/extensions
Strong reversal happens after the 3rd drive completes
📌 Alternate Bat Pattern
Similar to Bat but has a deeper B-point retracement (50% of XA instead of 38.2%)
More accurate for identifying trend continuation trades
📌 White Swan & Black Swan
Developed by harmonic trading expert Scott Carney
Similar to the Crab, but focuses on psychological market structure
🚀 How to Trade Harmonic Patterns Successfully
Step 1: Identify the Pattern & PRZ
Use harmonic pattern scanners or manual Fibonacci tools.
Step 2: Wait for Reversal Confirmation
Look for candlestick patterns (pin bars, engulfing candles).
Check RSI, MACD, and volume divergence.
Step 3: Place Your Trade
Entry: Once price reacts at PRZ.
Stop Loss: Beyond PRZ invalidation level.
Take Profit: Fibonacci retracement levels (38.2%, 61.8%, 100%, 161.8%).
🔥 Summary – Why Harmonic Trading Works
✅ High accuracy when Fibonacci ratios are respected
✅ Works across all timeframes (forex, stocks, crypto, indices)
✅ Combines price action, Fibonacci, and confluence factors
If you master these harmonic patterns, you'll consistently spot reversals early, maximize profits, and minimize risks! 🚀📈

BUY EURUSD (USING PRICE ACTION)Waiting the price go in the marking zone which is demand and the price already go in so we should wait a new confirmation such as rejection in the zone after that we looking for a good position to buy, otherwise, the zone is not valid and we should looking a new indicator using price action

EURUSD 15m TODAY!As I see here EU made a Swing and Internal Bullish structure that they both are on a same direction. long trades will be high probable thanks to swing and internal structure but I myself don't have and ideas for sell now, in reason of market structure.

EURUSD: Will Keep Falling! Here is Why:
Looking at the chart of EURUSD right now we are seeing some interesting price action on the lower timeframes. Thus a local move down seems to be quite likely.
❤️ Please, support our work with like & comment! ❤️

My trade of the day, London session 2/19/2025Big timeframe is bearish, so I was looking for shorts. On my entry, the SL was above the FVG that was formed by the reaction to the IFVG, and my take profit was at the first sell-side liquidity.
