SMALL SELL EURUSDSmall scalp EURUSD. Dollar strength still weakening long term relative to EUR as war starts closing out. Retracement push likely. Aiming for lower risk small scalp adjustable from 25% to 50% of normal risk tolerance.
EURUSD_TOM trade ideas

EURUSD Continues its BULLISH TREND.No any bearish divergence on RSI.
.Fibonacchi exactly retrace on 0.50 Value
.Take entry on Last HH buy stop
.Drive with the trend.

EURUSD long 3.67RR1. Downtrend Reversal: The price was initially in a downtrend, as indicated by the descending trendline.
2. Breakout Confirmation: The price broke above the 1-hour trendline, signaling a potential trend reversal.
3. Buy Limit Strategy: Instead of entering immediately, a buy limit order was placed at a key support zone after the breakout.
4. EMA 21 as Support: The price respected the 21 EMA, confirming bullish momentum.
Strong Bullish Move: After triggering the buy limit, the price surged upwards, resulting in a profitable trade.
5. Risk Management: Stop-loss was placed below a key support zone, minimizing risk while allowing room for price fluctuations.

EUR/USD Market Update: Bullish Momentum in Play
CAPITALCOM:EURUSD
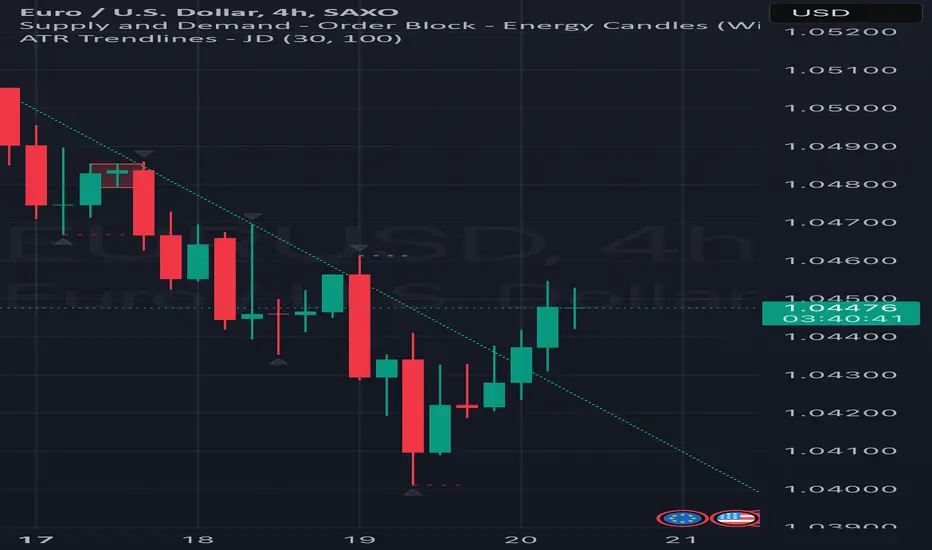
We just updated our analysis according to the latest price action. Today's move gave us solid confirmation of the bullish trend. The market pulled back to 1.04276, touched our support level perfectly, and then bounced back up—just as expected. We've adjusted our star pattern while keeping the same key levels intact.
Chart Analysis:
Current Situation: The price is currently hovering around 1.04878, showing good strength after the bounce.
Support Level: 1.04276 proved itself as a solid support. The price respected this level, giving us more confidence in our bullish bias.
First Target: Our immediate target is 1.05415. This level lines up nicely with both our geometric grid and historical resistance. If the price keeps this momentum, it shouldn't take long to reach it.
Key Levels to Watch:
1.06440: This is the next resistance level. If we break through 1.05415, this is where we’ll focus.
1.07469 and 1.08626: These are more ambitious targets but definitely possible if the bullish momentum continues.
1.10834: This would be a real win, indicating a strong shift in the overall trend.
What the Chart Tells Us:
The updated chart shows how our geometric grid aligns with price action. The white "star" pattern gives us a roadmap, and the red dashed lines highlight important time pivots. These intersections often guide the price, so I’m keeping a close eye on them.
The recent "choch 4h" at 1.03738 marks a change of character on the 4-hour chart. It’s a good sign that the bearish phase might be behind us, and we’re in a new bullish cycle.
Bottom Line:
We’re on track toward 1.05415, and if the market keeps this pace, higher targets could be in play. I’ll be watching how the price reacts around our geometric intersections and adjusting as needed. The plan is simple: ride the bullish wave but stay ready in case the market throws us a curveball.

EURUSD TECHNICAL ANALYSIS TARGET WIN This chart is a EUR/USD (Euro to US Dollar) 1-hour timeframe analysis published on TradingView. Here’s what it shows:
1. Support Zone (Green Highlighted Area) – The price bounced from a key support area, where buyers stepped in to push the price higher.
2. Bullish Move (Blue Arrow) – The price started an upward movement after reaching the support level.
3. Target Achieved (Black Arrow & Text) – The price hit the predefined target at 1.04749, confirming a successful trade setup.
4. Profit Confirmation (Checkmark & Green Label) – The label shows a price gain of 0.02983 (or 7.972M in volume), indicating a profitable trade.
This chart likely represents a trading idea where a long (buy) position was taken from the support zone, and the target was successfully reached.

EURUSD technical analysis archived my target done after chart EURUSD technical analysis archived my target done after chart
Not financial advise trade and manage your own risk

USD/EURLooking at the USD/EUR exchange, USD looking short at the moment in h4 as well. Price is below the cloud + Fibonacci also suggest a pullback. Good for euro 💶 in my opinion 😎.


Bearish continuation A return to premium
Buy side liquidity taken in form of equal highs
Sell side liquidity is the next target

EURUSD 20 Feb 2025 W8 - Intraday - US Unemployment ClaimsThis is my Intraday analysis on EURUSD for 20 Feb 2025 W8 based on Smart Money Concept (SMC) which includes the following:
Market Sentiment
4H Chart Analysis
15m Chart Analysis
Market Sentiment
Some USA economic news today:
US : Unemployment Claims & Philly Fed Manufacturing Index
The market still in the same sentiment detailed in my Weekly Analysis . Below a summary:
Short-Term Bias: Cautiously bullish for EUR/USD, driven by optimism over delayed tariffs, geopolitical progress, and hopes for softer inflation.
Key Risks:
A hot PCE report reviving Fed hawkishness.
Sudden tariff escalations or breakdowns in peace talks.
4H Chart Analysis
1️⃣
🔹Swing Bullish (Reached Swing Extreme Demand)
🔹INT Bearish (Reached Extreme Supply)
🔹INT-INT Bullish (Reached EQ (50%)
🔹Swing Continuation
2️⃣
🔹With the deep pullback to the Bullish Swing extreme discount and mitigating the 4H/Daily demand zones, price turned Bullish forming a Bullish CHoCH.
🔹The current Bullish move from Swing extreme discount to current price level having 2 scenarios (Previously I’d the following 2 scenarios where now I favors the 2nd scenario due to the impulsive nature of the move):
Scenario 1: Pullback for Bearish INT Structure and with the recent Bearish CHoCK and Minor Demand zones are failing, I expect Bearish continuation to target the Weak INT Low which aligns with the Daily/Weekly Bearish Structure/Move. (Counter Swing – Pro Internal)
Scenario 2: Bullish Swing continuation to target the Weak Swing High. Which requires to have Demand holding and Supply failing. The first sign required to confirm this scenario will be the current Demand which price is currently at to hold and we form a Bullish CHoCH. (Pro Swing – Counter Internal)
🔹With the recent moves, Minor Supply is holding and demand is failing to facilitate the INT-INT Bullish structure Pullback which reached the structure EQ (50%).
3️⃣
🔹After the Bullish ii-BOS, price pulled in a corrective PA to the structure EQ (50%) and currently within the Daily Demand.
🔹Still expectation is set to continue Bullish targeting the Weak Swing High as long LTFs holds Bullish structures. Also, In my mind I’m not neglecting the current Bearish 4H INT structure and we already reached that structure extreme where we are getting the current corrective Bearish OF.
15m Chart Analysis
1️⃣
🔹Swing Bullish
🔹INT Bearish
🔹Reached Swing EQ (50%)/Discount
🔹Swing Pullback Phase
2️⃣
🔹The 15m Bullish Swing pullback phase is still intact with continues Bearish INT structures.
🔹Price had reached Swing extreme demand in Swing Discount.
🔹With the recent Bearish iBOS, price had formed Liq. above the 15m Demand which was sept with the break of the Weak INT Low, mitigating the 15m Demand and forming a Bullish CHoCH to initiate the Bearish INT Structure Pullback.
🔹Technically Shorts is the straight forward play (Played very well yesterday as per expectations and executions), but keep in mind that the Bearish INT structures task is to facilitate the 15m Swing Pullback and we are currently in the Swing Discount Zone and if the Swing is going to continue Bullish, there is a high probability that the INT Structure is going to shift Bullish.
3️⃣
🔹It’s a crossroads! Expectations is for price to turn Bullish and create a Bullish INT structure to confirm the Swing Pullback is over and the start of the Swing Bullish continuation Phase (Bullish iBOS for confirmation).
🔹Will be looking for longs after Bullish iBOS. As for Shorts, not in my interest currently based on where we are within the 115m Swing (Discount)/15m & 4H Demand even with the INT structure is Bearish.

EU - Candle imbalance filledWe have filled the candle imbalance also known as the 15m fair value gap. We have also tapped into an important bullish order block. I expect to see continuation long here to at least retest the most recent highs.

Anticipating a EUR/USD Pullback from a Rising Wedge FormationSetup Overview: The EUR/USD chart shows a rising wedge pattern, which is typically considered a bearish reversal pattern. This suggests that despite the recent uptrend, the pair could be poised for a downward reversal. The blue arrow indicates a potential future path for price action, suggesting that after rising slightly within the wedge, the price might break lower.
Trade Strategy:
Entry Point: Look for a confirmation of a price breakdown below the lower trendline of the wedge before entering a short position. This breakdown should ideally occur with increased volume or other bearish indicators like a bearish candlestick pattern.
Stop Loss: Set a stop loss just above the last swing high within the wedge or at the upper trendline of the wedge to protect against potential reversals to the upside.
Take Profit: The first target can be set near the 0.382 Fibonacci retracement level from the wedge's start to the breakdown point. Additional targets could be placed at the 0.618 and 0.786 Fibonacci levels if the downward movement gains momentum.
Risk Management: Monitor key economic releases or market events that could impact the EUR/USD pair, as these might trigger volatility that could either enhance the trade or cause unexpected reversals. Adjust stop losses and take profit levels accordingly as the trade progresses.
This setup is based on typical behaviors associated with rising wedge patterns and anticipates a return to lower support levels, providing a strategic entry for a short position with clearly defined risk and profit targets.

New York Session Recap - EURUSDTook 1 trade on EURUSD in New York Session. Weekly False Breakout setup.

#EURUSD 1H Potential riseHello Traders
I see the EUR/USD bullish wave and the price has fallen in a corrective manner. I expect another bullish wave to start from here.

EURUSD - PoVThe EUR/USD exchange rate is influenced by several economic and political factors, suggesting that the euro may continue to weaken in the coming weeks. On one side, the United States is implementing expansive fiscal policies that could strengthen the dollar, such as economic stimulus and increased public spending. These factors, along with potential protectionist measures like tariffs on Europe, could further weaken the euro by reducing the competitiveness of European exports. Additionally, the **Federal Reserve's** monetary policy, which has raised interest rates to combat inflation, makes the dollar more attractive to investors, increasing demand for the U.S. currency. The United States' energy independence, due to increased domestic production of gas and oil, has also reduced its reliance on imports, which further strengthens the dollar compared to the euro.
On the other hand, the Eurozone is facing a series of economic and political challenges that are putting pressure on the single currency. High inflation is eroding purchasing power across the Eurozone, and despite the European Central Bank (ECB) raising interest rates to combat it, economic growth remains slow. This divergence from the United States, where growth has been more dynamic, amplifies the euro's weakness. Moreover, the ongoing energy crisis in Europe, worsened by the war in Ukraine and reduced gas supplies from Russia, has increased costs and slowed the competitiveness of European businesses. In this context, political uncertainties in some Eurozone countries and the ECB’s less aggressive economic management compared to the Fed further contribute to the euro's weakness.
Therefore, the strengthening of the dollar, driven by U.S. policies and growing energy independence, and the structural weakness of the Eurozone, are likely to continue pushing the EUR/USD lower in the coming weeks.

EUR/USD on the 1-hour timeframe.Technical analysis check captainKey Observations:
1. Support Zone:
The highlighted yellow-green zone represents a support area where buyers are expected to step in.
The price has touched this zone and is showing signs of a potential reversal.
2. Expected Move (Arrows):
The blue arrow suggests a potential short-term pullback before a rise.
The black arrow represents the main bullish move, indicating a possible rally toward higher levels.
3. Technical Analysis:
The pair is reacting to a previous support level, which could lead to a bullish bounce.
If the price holds above this zone, it may continue upward toward 1.04500 and beyond.
Conclusion:
This setup suggests a buy opportunity if the price confirms a reversal from the support zone.
Invalidation: If the price breaks below this support, the bullish outlook weakens.
Next Resistance: Around 1.04500 - 1.05000.
Are you planning to enter this trade, or waiting for further confirmation?

Short trade
Sellside Trade
Pair: EURUSD
Date: Monday, 17th February 2025
Time: 3:00 AM (NY Time)
Session: Tokyo to London Session AM
Trade Details:
Entry: 1.04734
Profit Level: 1.04092 (+0.61%)
Stop Level: 1.04987 (-0.24%)
Risk-Reward Ratio (RR): 2.54
Sellside trade is structured around a bearish market structure, liquidity grabs, and session timing,

#004 Trust The Process EURUSD Buy 1539SGT 14022025Just bought EURUSD after HK33HKD(Oanda) position got closed out for a profit of 1.5R TP.
I do not shift my SL to breakeven, or take profit earlier. I feel that is very extra and adds in way too many variables then neccessary.
40% to breakeven. Even with multiple consecutive losses, we will win some time, enough to recoup some of our losses.
1541SGT 14022025

TRADING PLAN: EU SHORT TRADE SETUP Considering the bearish sentiment in EU today, and the successful liquidity grab at the Asian session high, we'll take a short position. Our initial target is a 1:1 risk-reward ratio, followed by a 1:2 ratio after securing some profits.

EURUSD Trade Analysis 2 Macro LondonEURUSD Trade Analysis
2 Macro London
Asia creates equal lows in a discount. Price comes up to the 50% and creates session equal highs. For 2 hours spools in a tight range. By 12:30 it aggressively rallies past the 50 to equal highs and into a noted FVG. By 1:30 it peaks and breaks down in a premium. Creates a FVG and 2 candle spikes into it and on previous days MOG. (All seen on a LTF)
Model review
Liquidity from previous session is taken
Price is in a session premium
Price rebalanced a FVG
Created a FVG to go it to at 2
Price is breaking down in a macro with a identified session bias
DXY was in a discount providing confidence it would seek out the 50 level-which it did.
3 sell side targets for scaling
Current range bias in Asia was on the 50, and price went above tricking traders we are going long so they can deal their shorts.
This is classic ICT 2022 and other blended ideas. It does not get more perfect than this. The hesitation is not sticking to my parent bias which is bull. And yet I suspected this week we could see lower prices as price could gravitate to the current range 50 seeking liquidity. A nice 20 pips consistently is what Im working towards.

Fundamental Market Analysis for February 19, 2025 EURUSDU.S. President Donald Trump said late Tuesday that he would likely impose tariffs on imports of cars, semiconductors and pharmaceuticals of about 25%, with an announcement to follow as early as 2 April.
Ukrainian President Volodymyr Zelensky said a peace deal could not yet be concluded. He postponed his visit to Saudi Arabia, scheduled for Wednesday, until 10 March to avoid giving ‘legitimacy’ to the US-Russia talks. This uncertainty could lift the US dollar and serve as a tailwind for the pair.
Investors are awaiting the release of the minutes of the January FOMC meeting, which are due to be released later on Wednesday. This report could provide some clues as to how policymakers assess the risk of a global trade war.
On the other side of the pond, the ZEW Eurozone Economic Sentiment Index came in at 24.2 in February versus 18.0 previously, missing expectations. Rising bets that the European Central Bank (ECB) will cut interest rates three more times this year could put pressure on the Euro (EUR).
Trade recommendation: SELL 1.0450, SL 1.0500, TP 1.0350

EURUSD Trade Idea – Market ObservationLong trade on EURUSD based on market structure and key price zones.
Beautiful Setup, Let’s see how this plays out!
