SELL EUR/USDTechnical vol high retracement. I'm looking for shorts. Speculative guess based on how usd will react to Trump and EUR zone differential and fair market value.
EURUSD_TOM trade ideas

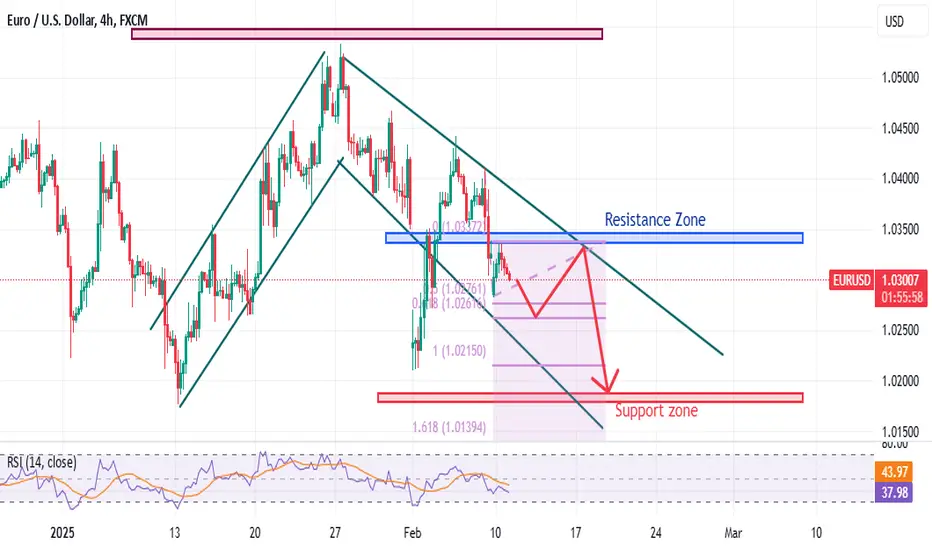
Short Sell EUR/USDFMV fill. Down to the relative low from retracement. Market sentiment showed bullish volume with thinning volume coming down. Going to have a price readjustment with a small retracement with a push to the downside.

EUR/USD NEXT MOVESell after bearish candle stick pattern, buy after bullish candle stick pattern....
Best bullish pattern , engulfing candle or green hammer
Best bearish pattern , engulfing candle or red shooting star
NOTE: IF YOU CAN'T SEE ANY OF TOP PATTERN IN THE ZONE DO NOT ENTER
Stop lost before pattern
R/R %1/%3
Trade in 5 Min Timeframe, use signals for scalping

eurusdmore falls after a little rising,
let see how price acting
what do you think guys
are you agree with me

Fundamental Market Analysis for February 11, 2025 EURUSDOn Monday, the EUR/USD exchange rate experienced a decline of approximately a third of a percentage point, reaching 1.03000 as market sentiment moderated. Investors are anticipating clearer signals from central bank policymakers, however, the recent series of executive orders on tariffs issued by US President Donald Trump has introduced an element of uncertainty.
European data is generally limited this week, with a speech from European Central Bank (ECB) President Christine Lagarde failing to elicit significant movement. This routine speech is a staple in ECB policymakers' talking points.Federal Reserve (Fed) Chairman Jerome Powell is scheduled to deliver his latest testimony to the US Senate Banking Committee, where he is expected to address concerns regarding the Fed's response to the fluctuating tariff threats posed by President Trump.
Germany's final Harmonised Index of Consumer Prices for the year ending January is scheduled for release on Thursday, and EU gross domestic product data for the fourth quarter is due on Friday. Neither of these indicators are expected to undergo significant change.Key data this week will be US consumer price index (CPI) inflation, released on Wednesday, and the US producer price index (PPI), released on Thursday.
Trading recommendation: BUY 1.03100, SL 1.02850, TP 1.03600

No Change in EURUSDEURUSD remains around the 1,0300 level without a clear direction.
Tomorrow's USD news is expected to bring increased volatility.
Watch for a higher low and a test of resistance levels.
At the current levels, there is no reason to enter a trade!

EUR USD EUR USD
daily Bias to the downside, wont be rushing in to sell. would need to see some rejection in the Red box area.
DXY for me is looking bullish

EURUSD 11 Feb 2025 W7 - Intraday Analysis - Powell & Tariffs!This is my Intraday analysis on EURUSD for 11 Feb 2025 W7 based on Smart Money Concept (SMC) which includes the following:
Market Sentiment
4H Chart Analysis
15m Chart Analysis
Market Sentiment
My Weekly Analysis HERE still the same as Tariffs is the main theme but market reaction is the key.
Is the market got used to the Tariffs news so reactions will be soft and fade or we are going to see more fear in the market with Tariff War narrative?
Today Powell will be the market mover as investors are waiting for a clue for direction.
4H Chart Analysis
1️⃣
🔹Swing Bullish
🔹INT Bearish
🔹Reached Swing Extreme Demand
🔹Swing Continuation
2️⃣
🔹With the deep pullback to the Bullish Swing extreme discount and mitigating the 4H/Daily demand zones, price turned Bullish forming a Bullish CHoCH.
🔹The current Bullish move from Swing extreme discount to current price level having 2 scenarios:
Scenario 1: Pullback for Bearish INT Structure and with the recent Bearish CHoCK and Minor Demand zones are failing, I expect Bearish continuation to target the Weak INT Low which aligns with the Daily/Weekly Bearish Structure/Move. (Counter Swing – Pro Internal)
Scenario 2: Bullish Swing continuation to target the Weak Swing High. Which requires to have Demand holding and Supply failing. The first sign required to confirm this scenario will be the current Demand which price is currently at to hold and we form a Bullish CHoCH. (Pro Swing – Counter Internal)
3️⃣
🔹Expectations is set to Bearish to target the Weak INT Low as long LTFs are staying Bearish.
15m Chart Analysis
1️⃣
🔹Swing Bearish
🔹INT Bearish
🔹Swing Continuation
2️⃣
🔹Price reached the Strong Swing High (4H CHoCH) sweeping the liquidity and turning INT structure to bearish with iBOS.
🔹INT Structure continuing Bearish following the 4H Bearish INT structure Continuation.
🔹Since yesterday market open, price is ranging within the Bearish INT structure.
🔹Current INT High is the 4H CHoCH which could be taken out as liquidity for continuation down.
🔹After reaching the Bearish INT structure extreme price is moving down in a corrective PA and currently in the extreme discount of the INT Structure.
🔹For me, I’d prefer to short from the 4H Supply after sweeping the 15m INT High (4H CHoCH). No Long setups/confirmations are clear for me.
3️⃣
🔹Expectation is for price to continue Bearish targeting the 15m Weak Swing Low.

EurUsd trade setup (10 feb)📈 Long Setup at Daily Demand Retest Zone
I'm considering a long position as 1.03072 aligns with my daily demand retest zone. This trade follows a fixed stop loss and target, maintaining a risk-to-reward (RR) ratio of 3.5.
🔹 Entry: 1.03148
🔹 Stop Loss: 1.03032
🔹 Target 1: 1.03328 (RR = 1.5)
🔹 Target 2: 1.03557 (RR = 3.5)
This setup is based on price reacting to a key demand zone, expecting a potential upside move. Let’s see how it plays out!

EUR_USD SUPPORT BELOW|LONG|
✅EUR_USD is trading in
A downtrend but the pair
Will soon hit a horizontal
Support of 1.0180 and
After the retest we will
Be expecting a local
Bullish rebound
LONG🚀
✅Like and subscribe to never miss a new idea!✅

EURUSD NEXT POSSIBE MOVESAXO:EURUSD
As of February 11, 2025, the EUR/USD pair is trading near the 1.0295 level, reflecting ongoing market reactions to recent geopolitical developments and economic data.
Technical Overview:
Current Price: Approximately 1.0295
Resistance Levels: 1.0350, 1.0400
Support Levels: 1.0250, 1.0200
Technical Indicators:
Relative Strength Index (RSI): Approaching oversold territory, suggesting potential for a corrective rebound.
Moving Averages: The pair is trading below both the 50-day and 200-day moving averages, indicating a bearish trend.
Trade Recommendation:
Given the current technical indicators and market conditions, initiating a buy position could be considered if the price shows signs of stabilizing above the 1.0250 support level.
Entry Point: Buy at 1.0310
Take Profit (TP): 1.0400
Stop Loss (SL): 1.0250
Risk Management:
This trade setup offers a 1.5:1 reward-to-risk ratio. Ensure that your position size aligns with your risk tolerance and overall trading strategy. Given the current volatility, it's crucial to employ strict risk management practices.
Conclusion:
The EUR/USD pair is currently under bearish pressure, but technical indicators suggest a potential for a corrective rebound. Traders should monitor price action closely and manage risk appropriately.
Disclaimer: Trading forex carries a high level of risk and may not be suitable for all investors. Ensure you fully understand the risks involved and seek independent advice if necessary.

Eurusd fallingI had a D1 eurusd analysis last week that was bullish. Price is on wave 3 of the large down trend and wave 3 on our correction phase currently. I’m seeing down before back up to major resistance. Let’s see how this correction plays out.

Which way will the Eur/USD pair go?EUR/USD Market Update:
🔆The US dollar continued to strengthen amid ongoing developments in President Trump’s tariff policies. While the widely debated 25% tariffs on Canadian and Mexican imports have been postponed, the 10% tariffs on Chinese goods remain unchanged. The lack of clarity and uncertainty from the White House initially led investors to unwind their long positions in the dollar early last week.
🔆However, the greenback regained momentum over the weekend after President Trump announced plans to introduce a new 25% tariff on all steel and aluminum imports into the US, in addition to the current tariffs on these metals.
🔆Investors are now closely watching Fed Chair Powell’s speech today. In the past, the Fed has maintained a hawkish stance amid concerns over Trump’s trade and fiscal policies. Meanwhile, the ECB recently cut interest rates by 25 basis points in an effort to address slowing economic growth and persistent inflation above its 2% target.
Personal Insight:
🔆The euro faces significant headwinds. A robust US dollar, diverging monetary policies between the Fed and the ECB, and internal challenges within the eurozone—such as Germany’s economic slowdown—could all put downward pressure on the single currency. While short-term rebounds are possible, the euro’s long-term trajectory remains uncertain, especially as global trade tensions, including those involving the EU, continue to unfold.
Technical Outlook:
🔆Analysis based on the RSI (4H) indicator, Fibonacci confluence trendlines, and key resistance-support levels.
Plan:
🔆 Price Zone Setup:
👉Buy EUR/USD 1.0330 -1.0345
❌SL: 1.0400 | ✅TP: 1.0300 – 1.026 – 1.021
GpPa Model / EUR/USD Dynamic Limit Order Long EntryGpPa Analysis / Entry Justification under the GpPa Model
*The Analysis is the same as the conservative and dynamic entry*
The main entry is conservative, so, the analysis remains beside this part:
A long entry can be considered at the strong minimum, but I'll not go too far with the SL or TP. It can be used as a hedge if you're holding a position that performs well as the US Dollar does (like Magnificent 7 or other shorts in x/USD currency). Beside that, I'll consider this position the riskier of all.
1. Liquidity
a. Liquidity Related to Structure
The price’s liquidity is distributed within a relatively narrow range, marked by several highs and lows and a false manipulative bias (indicated as internal liquidity in a lighter color). This liquidity distribution suggests a long-term and mid-term bearish trend (notably from the M3 and M1 timeframes backward) that has weakened in the short term, evolving into a chaotic structure.
b. Liquidity Related to Directionality
The diagonal liquidity—responsible for driving the price to manipulate highs and lows—is more pronounced at the highs. However, the directional bias appears to favor mitigating the lows.
c. Decision Regarding Liquidity
Recent price action indicates the development of a retracement. This retracement could either continue the bearish trend or lead to a range-bound structure due to an exhausted bearish trend.
2. Trajectory / Direction (Structure)
a. Coefficient of Trajectory, Direction, and Validation
(-41.20%; -58.80%) 19.10%
These coefficients confirm the signals derived from the liquidity analysis. While the price shows a clear long-term and mid-term bearish trend, the opposing validation factor may indicate an exhaustion of the retracement—or even of the trend itself—thus reinforcing the possibility of a range-bound market.
3. Entries
a. Conservative Entry
The VWAP is placed alongside an additional FRVP at the major fractal preceding the M1 structure to define a conservative entry. Once positioned, this setup confirms the bearish character and the established range, allowing the identification of a high-probability entry at the manipulated high. This entry is validated by:
- Long-term volume
- A high-probability VWAP zone for shorts within the range
- A long-term order block (M1)
i. Coefficients of the Conservative Entry
- Fractal Quality Coefficient: 50.00%
- Entry Quality Coefficient: -19.82%
- Entry Probability: -50.00%
- Stop Loss Probability: -100.00%
- Take Profit Probability: -50.00%
The entry is highly likely to be mitigated over the long term, with the conservative analysis expiring on March 25, 2025. Although the quality is decent, it is not optimal since the evaluation was based solely on the VWAP.
The Stop Loss is set at 2 ATR from the last manipulated high (calculated from the median of the data) and is strongly protected by volume, two highs, two order blocks, and the VWAP level. This setup reflects an extremely optimistic scenario for the euro, which does not fully align with recent fundamental news—suggesting that a significant move would be necessary to breach this level.
The Take Profit should be seen not as a final objective but rather as a target for partial profit-taking and for moving the stop to breakeven once the objective is reached.
4. Other Comments
- The price is currently in a zone that attracts little interest from swing traders. As of February 10, 2025, the price is in a well-developed retracement, which discourages taking shorts lightly.
- A long trade might be considered at the manipulated minimum below the structure; however, given the euro’s recent fundamentals and the prevailing long-term and mid-term bearish trend, such a trade should only be executed with carefully adjusted Stop Loss and Take Profit levels.
Do you like my analysis?
Follow me on social media: thewayofrichie
Let's trade,
Richie

GpPa Model / EUR/USD Balanced Limit Order Short EntryGpPa Analysis / Entry Justification under the GpPa Model
*The Analysis is the same as the conservative and dynamic entry*
The main entry is conservative, so, the analysis remains beside this part:
If we're not sure if the conservative entry can be mitigated, we can use the balance one. It uses the same VWAP level at the following fractal, just one maximum below.
1. Liquidity
a. Liquidity Related to Structure
The price’s liquidity is distributed within a relatively narrow range, marked by several highs and lows and a false manipulative bias (indicated as internal liquidity in a lighter color). This liquidity distribution suggests a long-term and mid-term bearish trend (notably from the M3 and M1 timeframes backward) that has weakened in the short term, evolving into a chaotic structure.
b. Liquidity Related to Directionality
The diagonal liquidity—responsible for driving the price to manipulate highs and lows—is more pronounced at the highs. However, the directional bias appears to favor mitigating the lows.
c. Decision Regarding Liquidity
Recent price action indicates the development of a retracement. This retracement could either continue the bearish trend or lead to a range-bound structure due to an exhausted bearish trend.
2. Trajectory / Direction (Structure)
a. Coefficient of Trajectory, Direction, and Validation
(-41.20%; -58.80%) 19.10%
These coefficients confirm the signals derived from the liquidity analysis. While the price shows a clear long-term and mid-term bearish trend, the opposing validation factor may indicate an exhaustion of the retracement—or even of the trend itself—thus reinforcing the possibility of a range-bound market.
3. Entries
a. Conservative Entry
The VWAP is placed alongside an additional FRVP at the major fractal preceding the M1 structure to define a conservative entry. Once positioned, this setup confirms the bearish character and the established range, allowing the identification of a high-probability entry at the manipulated high. This entry is validated by:
- Long-term volume
- A high-probability VWAP zone for shorts within the range
- A long-term order block (M1)
i. Coefficients of the Conservative Entry
- Fractal Quality Coefficient: 50.00%
- Entry Quality Coefficient: -19.82%
- Entry Probability: -50.00%
- Stop Loss Probability: -100.00%
- Take Profit Probability: -50.00%
The entry is highly likely to be mitigated over the long term, with the conservative analysis expiring on March 25, 2025. Although the quality is decent, it is not optimal since the evaluation was based solely on the VWAP.
The Stop Loss is set at 2 ATR from the last manipulated high (calculated from the median of the data) and is strongly protected by volume, two highs, two order blocks, and the VWAP level. This setup reflects an extremely optimistic scenario for the euro, which does not fully align with recent fundamental news—suggesting that a significant move would be necessary to breach this level.
The Take Profit should be seen not as a final objective but rather as a target for partial profit-taking and for moving the stop to breakeven once the objective is reached.
4. Other Comments
- The price is currently in a zone that attracts little interest from swing traders. As of February 10, 2025, the price is in a well-developed retracement, which discourages taking shorts lightly.
- A long trade might be considered at the manipulated minimum below the structure; however, given the euro’s recent fundamentals and the prevailing long-term and mid-term bearish trend, such a trade should only be executed with carefully adjusted Stop Loss and Take Profit levels.
Do you like my analysis?
Follow me on social media: thewayofrichie
Let's trade,
Richie

GpPa Model / EUR/USD Conservative Limit Order Short EntryGpPa Analysis / Entry Justification under the GpPa Model
1. Liquidity
a. Liquidity Related to Structure
The price’s liquidity is distributed within a relatively narrow range, marked by several highs and lows and a false manipulative bias (indicated as internal liquidity in a lighter color). This liquidity distribution suggests a long-term and mid-term bearish trend (notably from the M3 and M1 timeframes backward) that has weakened in the short term, evolving into a chaotic structure.
b. Liquidity Related to Directionality
The diagonal liquidity—responsible for driving the price to manipulate highs and lows—is more pronounced at the highs. However, the directional bias appears to favor mitigating the lows.
c. Decision Regarding Liquidity
Recent price action indicates the development of a retracement. This retracement could either continue the bearish trend or lead to a range-bound structure due to an exhausted bearish trend.
2. Trajectory / Direction (Structure)
a. Coefficient of Trajectory, Direction, and Validation
(-41.20%; -58.80%) 19.10%
These coefficients confirm the signals derived from the liquidity analysis. While the price shows a clear long-term and mid-term bearish trend, the opposing validation factor may indicate an exhaustion of the retracement—or even of the trend itself—thus reinforcing the possibility of a range-bound market.
3. Entries
a. Conservative Entry
The VWAP is placed alongside an additional FRVP at the major fractal preceding the M1 structure to define a conservative entry. Once positioned, this setup confirms the bearish character and the established range, allowing the identification of a high-probability entry at the manipulated high. This entry is validated by:
- Long-term volume
- A high-probability VWAP zone for shorts within the range
- A long-term order block (M1)
i. Coefficients of the Conservative Entry
- Fractal Quality Coefficient: 50.00%
- Entry Quality Coefficient: -19.82%
- Entry Probability: -50.00%
- Stop Loss Probability: -100.00%
- Take Profit Probability: -50.00%
The entry is highly likely to be mitigated over the long term, with the conservative analysis expiring on March 25, 2025. Although the quality is decent, it is not optimal since the evaluation was based solely on the VWAP.
The Stop Loss is set at 2 ATR from the last manipulated high (calculated from the median of the data) and is strongly protected by volume, two highs, two order blocks, and the VWAP level. This setup reflects an extremely optimistic scenario for the euro, which does not fully align with recent fundamental news—suggesting that a significant move would be necessary to breach this level.
The Take Profit should be seen not as a final objective but rather as a target for partial profit-taking and for moving the stop to breakeven once the objective is reached.
4. Other Comments
- The price is currently in a zone that attracts little interest from swing traders. As of February 10, 2025, the price is in a well-developed retracement, which discourages taking shorts lightly.
- A long trade might be considered at the manipulated minimum below the structure; however, given the euro’s recent fundamentals and the prevailing long-term and mid-term bearish trend, such a trade should only be executed with carefully adjusted Stop Loss and Take Profit levels.
Do you like my analysis?
Follow me on social media: @thewayofrichie
Let's trade,
Richie

EUR/UISD - Strong Trade Setup (XCI Model)Hi all, If you have been following you would have seen I have been winning a lot of trades recently.... well, I have a new entry model Ive been playing with that works on any time frame in any market. Im naming it XCI.
I wont be posting with how it works in here but I will be sharing my trade setups I use it in.
This is one of them
Liquidity Sweep taken on a Long Term Bearish Market. Market jump left Imbalance to fill giving us a strong level to sell from. We have our OTE Zone Marked out with the discount zone we want to see price move into before selling off
Good Luck to the traders that follow

Cooler heads prevail...at least for now | FX ResearchInvestor risk appetite is picking up as the new week gets going. There were some initial jitters in Asia, but cooler heads have prevailed for now. Uncertainty around U.S. tariffs remains a key focus for the market.
The latest announcement from Trump includes a 25% tariff on all steel and aluminum imports into the U.S. from all countries. He has also stated that Canada and Mexico have not taken enough action to avoid the previously threatened tariffs.
Looking ahead, the economic calendar is relatively quiet today. However, the week will bring key events, including U.S. CPI, retail sales, and Federal Reserve Chair testimony. Today’s notable events include the Bank of Canada Market Participant Survey, U.S. consumer inflation expectations, and an ECB appearance by Christine Lagarde.
Exclusive FX research from LMAX Group Market Strategist, Joel Kruger

Institutional Market Structure: How to Mark It!2025 ICT Mentorship: Lecture 2
Video Description:
📈 Unlock the Secrets of Institutional Market Structure!
Hey traders! Welcome to today’s video, where we lay the foundation for mastering how the market truly moves. Understanding market structure is the key to improving your trading precision and analysis.
In this session, we’ll break down the difference between minor swing points and strong swing points—a crucial distinction for objective and accurate structure analysis. You’ll learn how to mark market structure properly, keeping emotions in check and aligning with solid trading psychology.
🎯 What You’ll Gain:
✅ Identify market structure like a pro
✅ Enhance your objectivity and reduce impulsive decisions
✅ Master institutional techniques for improved accuracy
If you’re ready to take your trading to the next level and build a strong foundation, hit play and let’s dive in!
💬 Don’t forget to like, comment, and subscribe for more game-changing insights. Share your thoughts below—I’d love to hear how this helps your trading journey!
Enjoy the video and happy trading!
The Architect 🏛️📊

EURUSD 10 February 2025 TRADE IDEAThe EUR/USD pair remains in a long-term downtrend, as indicated by the descending trendlines and the formation of lower highs and lower lows. Recent price action shows a rejection from the 1.0400 - 1.0514 supply zone, suggesting strong bearish momentum. Price is likely to target the next demand zone around 1.0000 - 0.9935, as order flow and smart money concepts (SMC) indicate further downside. A break of structure (BOS) confirms continued bearish intent, while liquidity grabs and fair value gaps (FVGs) suggest price may seek equilibrium near 0.9800 - 0.9400 in the longer term. Fundamentally, the U.S. dollar remains strong due to the Federal Reserve’s hawkish stance, resilient labor market data, and persistent inflation, while the Eurozone faces economic struggles, with the ECB being less aggressive on rate hikes due to slowing growth. Geopolitical tensions, such as the Russia-Ukraine war and Middle East conflicts, add to global risk-off sentiment, further strengthening USD as a safe-haven asset. If price breaks below 1.0000, further declines toward 0.9935 - 0.9800 are expected, while a sustained break above 1.0514 would challenge the bearish outlook.

ICT trade on EU EUR USD entry
1, M30 candlestick close 3 pin doji
2, 61.8 fib
3, FVG at 8.30am NY should wait for 9am
4, Asian highs taken out and now it will go for
Asian lows.
5, 18 pip SL going for 28 to 30 pips risk ratio 1.66

EURUSD TECHNICAL ANALYSIS NEXT MOVE POSSIBLE.EURUSD Forecast and technical analysis M30 next move possible. Just wait for trend line breakout. Then we expect upside aggressive move. not financial advice,

EURUSD ShortWaiting for London open to see the price action, but on 15M I am looking for sweep of Buyside liquidity and grab small liquidity by the target to Sellside.
