EURUSD_TOM trade ideas

Short then Buy!Hello all. The last analysis is valid. The shadow was a Reverting T.S and the response is on another T.S. LFT Zone. be happy and go sell at lower Time Frame the go buy on T.S. by huge volume(wink)----- IT is just my analysis and use your confirmation method to entry. the best confirmation is PS.

Temporary Short!Hello all. for who wants to catch most of the market, it's a good OPP to go short with R:R more than 10. be happy and enter by your method. It is just a guide and carry lots of risk during this zone.

EUR/USD : More Fall Ahead? Let's See! (READ THE CAPTION)By analyzing the EUR/USD chart on the three-day timeframe, we can see that the price was rejected from the 1.053 level, as per our main analysis, leading to a decline of over 300 pips down to 1.021.
Currently, EUR/USD is trading around 1.036, and if the price stabilizes below 1.042, we can expect further downside movement. Keep an eye on the price reaction to the key levels marked on the chart!
Please support me with your likes and comments to motivate me to share more analysis with you and share your opinion about the possible trend of this chart with me !
Best Regards , Arman Shaban

EUR/USD : Get Ready for the next Bearish move (READ THE CAPTION)By analyzing the #EURUSD chart on the 3-day timeframe, we can see that after rising to the upper limit of the supply zone at 1.046 - 1.055, the price has finally corrected and is currently trading around 1.042. If the price stabilizes below this level, we can expect further declines in EURUSD.
However, keep in mind that in about 2.5 hours, we have the significant CB Consumer Confidence report, which could strongly impact the market!
Please support me with your likes and comments to motivate me to share more analysis with you and share your opinion about the possible trend of this chart with me !
Best Regards , Arman Shaban

EUR/USDSell after bearish candle stick pattern, buy after bullish candle stick pattern....
Best bullish pattern , engulfing candle or green hammer
Best bearish pattern , engulfing candle or red shooting star
Stop lost before pattern
R/R 1/3

EURUSD DAILY 06/02/25EUR/USD stays under bearish pressure on Thursday and trades below 1.0400, after closing the previous two days in territory. The pair's technical outlook highlights buyers' hesitancy as market attention shifts to sellers and macroeconomic data releases.

EUR/USD Precision Trading: Dual-Entry Strategy for Max ProfitEUR/USD Smart Entry Strategy: Dual Entries for Maximum Profit Potential
In this setup, I executed a long position on EUR/USD at Entry 1 (1.03602 USD), capitalizing on a well-established support zone and preparing for a potential bullish reversal. To enhance risk management and maximize profit potential, I have also placed a second entry (Entry 2 at 1.03313 USD) in case of a deeper pullback, allowing me to average into the trade at a better price.
Key Elements of the Setup:
Support & Resistance Analysis:
Entry 1 (1.03602 USD): Placed at a weak support zone, where previous price action showed reactions.
Entry 2 (1.03313 USD): Positioned near a stronger support level, providing a better risk-reward entry if price dips further before reversing.
Stop Loss (1.03035 USD): Positioned below the major support zone, ensuring the trade has room to develop while limiting downside risk.
Take Profit Strategy:
Take Profit 1 (1.03885 USD): Located just below a resistance level, securing partial gains before potential rejection.
Take Profit 2 (1.04141 USD): Aiming for the next major resistance level, maximizing profit potential if bullish momentum continues.
Risk Management & Trade Psychology:
By using a dual-entry strategy, I minimize the impact of short-term volatility and improve my overall entry price if the market dips further.
My stop loss placement ensures that if the trade setup invalidates, I exit with minimal damage while maintaining a solid risk-to-reward ratio.
Conclusion:
This trade leverages key support zones, a layered entry strategy, and a well-defined risk-reward framework. If the market respects these support levels, I aim to ride the bullish momentum towards both Take Profit targets, securing a high-probability trade with controlled risk.
FX:EURUSD FOREXCOM:EURUSD OANDA:EURUSD

EUR/USD SELL $$$
Well, as I analyzed for you yesterday, the Euro also fell on the 15-minute time frame.
I have 3 scenarios in mind for the Euro
Scenario 1: It falls after breaking through the last 15-minute block order zone
Scenario 2: It falls after hitting the upper zone
Scenario 3: It falls after taking liquidity from the Asian ceiling

Gold Trade plan 06/02/2025Dear Traders,
Looking for buy 1.02800-1.030000 To target 1.04500-1.06000
Wave 1 almost Completed ...and correction phase started,
If you enjoyed this forecast, please show your support with a like and comment. Your feedback is what drives me to keep creating valuable content."
Regards,
Alireza!

Will EURUSD Continue to Rise?When the EURUSD 8-hour chart is examined; It is observed that price movements continue above the support zone. As long as the EURUSD 1.0263 level is not broken down, it is evaluated that the price movements above the 1.0341 level may exceed the 1.0519 level and target the 1.0674 level.

EUR: Some renewed attention on UkraineOne wild card for EUR/USD this year is what happens in Ukraine. Yesterday the FX market took note of the further rise in Ukraine's hard currency bonds, amid optimism that negotiations could bring a potential peace deal closer.
Reports that the US will unveil a peace plan at next week's Munich security conference, in addition to signs that both countries’ leaders are softening their stance towards potential talks, are positive triggers. Last year’s restructured bonds reached their highest price since issue, while the nation’s GDP warrants reached their highest price since January 2022, after steady gains since mid-2024. Developments here will be watched next week and could offer a little support to EUR/USD.
As above with our DXY comments, the question is whether tomorrow's US jobs numbers need to drive the EUR/USD correction briefly back up to the 1.0530/70 area. We cannot rule that out, but doubt that any gains above 1.05 hold for long. We're still happy to look for a move back to 1.02 later this quarter, with 1.00 the likely trajectory in the second quarter when broader US tariffs are brought in.
1.0370-10450 should be the extent of the EUR/USD range today. We doubt eurozone retail sales for December or ECB speakers (Vujic and Nagel) will be a market mover today.

Trendline testing - It seems like the Euro USD is testing the trend line on a daily And also under 15 minutes.
Option market is pointing to 1:05 But at the same time, the risk of I'm saying something about the European tariffs is raising minutes by minutes.
Key resistance 1:0482-R1
1.4420-R2
1.0512-R3
Good until February 5 22:00 Budapest Time

EURUSD - Short Scalp (ICT Concepts)Short scalp on EURUSD using ICT Concepts amongst my own methodologies.
Apologies for no sound, error with the microphone.
Was either expecting a bounce at this iFVG 12h highlighted in maroon, or lower prices. Resistance at the upper threshold of the iFVG indicates resistance, following by CPDAs. Decided to change my buy stop order to market sell.
- R2F Trading

Fundamental Market Analysis for February 6, 2025 EURUSDThe euro is trying to consolidate after breaking a six-day losing streak, with EUR/USD still holding at 1.0400.
US employment change data from ADP showed stronger-than-expected results for January, with a net increase in the number of people employed coming in at 183k, beating the expected decline to 150k from December's revised 176k. While the ADP jobs data unreliably predicts the US Non-Farm Payrolls (NFP) data expected later in the week, the increase bolsters investor confidence that the US economy remains on solid ground.
Early Thursday will see the release of pan-European retail sales data for December. Median forecasts expect the figure to rise to 1.9% y/y, up from 1.2% in the previous period. However, the month-on-month figure is expected to fall to -0.1% from 0.1%.
The most important release this week will be the US Non-Farm Payrolls (NFP) report on Friday. Investors expect the January NFP to fall to 170k from December's 256k. Traders will also be watching for revisions to previous months' data. Those expecting a rate cut are becoming increasingly frustrated with the sustained strength of the US economy as labour statistics are often revised upwards.
Trade recommendation: Watch the level of 1.0370, when fixing below consider Sell positions, when rebounding consider Buy positions.

eurusd short sell at market tp 0140 +240 pips🔸Hello traders, let's review the h2 chart for EURUSD today.
Completed gap fill and triggered fresh liquidity with sl cluster
liquidations near 0400, right now reversal in progress expect dump.
🔸Gapped down at weekly open, gap fill completed now expecting
the dump to resume targeting fresh OB liquidity at 0140. market now
is 0370. 250 pips downside remains on sell side.
🔸Recommended strategy for EURUSD traders: short sell at market
TP1 +120 pips TP2 +240 pips final exit 0140. Expecting dump into
NFP this Friday. good luck traders!
🎁Please hit the like button and
🎁Leave a comment to support our team!
RISK DISCLAIMER:
Trading Futures , Forex, CFDs and Stocks involves a risk of loss.
Please consider carefully if such trading is appropriate for you.
Past performance is not indicative of future results.
Always limit your leverage and use tight stop loss.

EUR/USD Short Setup – Brokerir Exclusive AnalysisEUR/USD is currently approaching key resistance zones at 1.04232 and 1.04433, where selling pressure is expected to increase. Based on technical analysis, price action suggests a potential short opportunity, targeting 1.03885 as the next major support level. The setup aligns with multiple confluences, including resistance rejections, momentum indicators, and Fibonacci retracement levels, indicating a high-probability trade.
Key Technical Levels
Resistance Levels (Short Entry Points):
1.04232 – First resistance zone where sellers may step in.
1.04433 – Stronger resistance, marking a potential liquidity grab before a reversal.
Target Support:
1.03885 – The expected downside target based on prior support structures.
Technical Factors Supporting the Short Setup
1️⃣ Price Action & Market Structure
EUR/USD is in a corrective move within a broader downtrend, approaching resistance levels where price has previously struggled to break higher.
Bearish rejection wicks or reversal candlestick patterns in this zone will further confirm selling pressure.
2️⃣ Fibonacci Retracement & Resistance Confluence
The 1.04232 and 1.04433 levels align with key Fibonacci retracement zones, acting as strong resistance points where price may reverse.
3️⃣ RSI & Momentum Indicators
RSI is nearing overbought levels, signaling potential exhaustion of the recent bullish push.
MACD shows slowing bullish momentum, indicating a possible reversal.
4️⃣ Volume & Order Flow Analysis
Low buying volume near resistance suggests that buyers may struggle to push price higher, increasing the likelihood of a bearish move.
A bearish engulfing candle or strong rejection from 1.04232 or 1.04433 will confirm the short setup.
Conclusion & Market Outlook
📊 Brokerir's Analysis Team expects a short trade opportunity on EUR/USD from 1.04232 or 1.04433, targeting 1.03885, based on technical confluences, resistance rejections, and momentum indicators. Traders should wait for clear bearish confirmations before entering.
🚀 Bearish Confirmation: Strong rejection at 1.04232 or 1.04433 with a bearish candlestick pattern.
📉 Bullish Risk: A breakout above 1.04433 could trigger further upside movement.
⚡ Stay updated with Brokerir for expert market analysis and precise trade setups!

EURUSD Feb. 06, 2025All currencies appearing in this post are fictitious.
Any resemblance to real currencies, existing or dead, is purely coincidental.

EURUSDEUR/USD Overview
EUR/USD is the most traded currency pair in the world, representing the Euro against the U.S. Dollar. Its price reflects the relative strength of the European and U.S. economies and is influenced by monetary policy, economic data, and geopolitical events.
1. Key Factors Affecting EUR/USD:
• Monetary Policy:
• European Central Bank (ECB) and Federal Reserve (Fed) decisions on interest rates, quantitative easing, and forward guidance directly affect EUR/USD.
• Hawkish policies (rate hikes) strengthen a currency, while dovish policies (rate cuts, stimulus) weaken it.
• Economic Data Releases:
• U.S. Data: Non-Farm Payrolls (NFP), Consumer Price Index (CPI), Gross Domestic Product (GDP), and ISM reports.
• EU Data: German industrial output, Eurozone GDP, and inflation data (HICP).
• Key Events: ECB/Fed meetings, FOMC minutes, and speeches from central bank officials.
• Geopolitical Events:
• Political instability in the EU (e.g., elections, Brexit-type events) or U.S. fiscal uncertainty can cause volatility.
• Global crises often trigger a flight to the USD as a safe-haven currency.
2. Best Times to Trade EUR/USD:
• London Session (3:00 AM - 11:00 AM EST): High liquidity as European markets are active.
• New York Session (8:00 AM - 5:00 PM EST): Major U.S. data releases create volatility.
• London-New York Overlap (8:00 AM - 11:00 AM EST): The most volatile period, offering the best trading opportunities.
3. Trading Strategies for EUR/USD:
• Trend Following: Use moving averages (50-day, 200-day) to identify the dominant market trend.
• Breakout Trading: Trade significant support/resistance levels during economic releases or after consolidation periods.
• Range Trading: Take advantage of sideways markets by buying at support and selling at resistance.
• News-Based Trading: Quick reactions to unexpected data releases or central bank announcements.
4. Key Technical Indicators for EUR/USD:
• Moving Averages (MA):
• 50-day and 200-day MAs help determine trend direction and potential reversal points.
• Relative Strength Index (RSI):
• Overbought (>70) or oversold (<30) signals for potential reversals.
• MACD (Moving Average Convergence Divergence):
• Helps identify trend momentum and potential crossovers for buy/sell signals.
• Fibonacci Retracement:
• Identify potential retracement levels within a trend for optimal entries.
5. Risk Management for EUR/USD Trading:
• Set Stop-Loss Orders: Limit downside risk, especially during volatile news events.
• Position Sizing: Risk only 1-2% of your capital per trade to manage potential losses.
• Avoid Overleveraging: High leverage can lead to significant losses, particularly during unexpected news events.
• Stay Updated on Economic Calendar: Always be aware of upcoming data releases and central bank events.

EUR/USD Rises as Dollar Weakens Amid Trade War ConcernsThe euro climbed above $1.04 as a weaker dollar and Trump’s tariffs fueled economic concerns. China retaliated with its own levies, escalating trade tensions. Meanwhile, Eurozone business activity rebounded after two months of decline. The ECB cut rates and hinted at more easing in March, with US tariffs potentially pressuring it to loosen policy further. Investors now expect the ECB’s deposit rate to fall to 1.87% by December.
From a technical perspective, the first resistance level is at 1.0400, with further resistance levels at 1.0460 and 1.0515 if the price breaks above. On the downside, the initial support is at 1.0350, followed by additional support levels at 1.0220 and 1.0180.

EUR/USD 1-Hour Chart Analysis: Potential Reversal and BullishThe EUR/USD 1-hour chart reveals a potential buying opportunity based on several technical observations. The most prominent feature is the clear break of a prevailing downtrend line, signaling a possible shift in momentum from bearish to bullish. Price action has moved decisively above this broken trendline and is currently approaching a horizontal support zone (marked in purple). This zone, which has seen multiple touches, suggests a significant area of demand where buyers have previously entered the market. Adding to the bullish sentiment, the chart displays a strong bullish candle closing near its high, indicative of significant buying pressure. A potential long (buy) trade can be considered based on this confluence of factors. The red zone below the support level offers a defined area for placing a stop-loss order, allowing for controlled risk management. Conversely, the green zone above the current price action presents a potential take-profit target, creating a favorable risk-reward ratio. While these technical indicators suggest an upward move, confirmation is crucial. Traders should look for additional bullish signals, such as another strong bullish candle or a successful retest of the broken trendline as support. Analyzing trading volume would further validate the strength of the breakout. Finally, it's essential to consider the broader market context, including news events and overall trends in higher timeframes, before making any trading decisions. This analysis is for educational purposes only and does not constitute financial advice. Trading involves risk, and thorough due diligence is essential before any investment decisions

Increase in EURUSDYesterday, EURUSD continued its upward movement, reaching 1,0443.
Tomorrow, the NFP data is set to be released, which may cause a pause before the news.
The goal remains to test and break previous highs.
Watch for a higher low and potential buying opportunities.

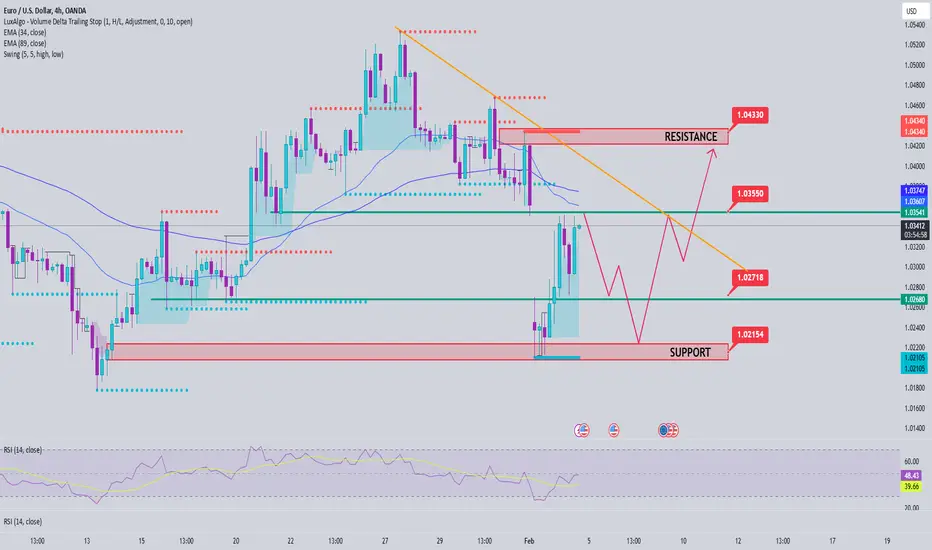
EURUSD Analysis February 4EURUSD is facing resistance at the 1.035 EMA. It is difficult to break this zone quickly. The pair may retest the 1.027 and 1.022 price zones to break the EMA zone to form an uptrend again. When still trading below the 34 and 89 EMA, the pair is still in a downtrend and prioritizes SELL signals.