Energy Web Token 3,200%—Keeping Simple (Pros Can Keep It Simple)I would like to call your attention to the orange line on the chart, 'support'. I will simplify the whole thing.
➖ EWTUSDT (Energy Web Token) went sideways (consolidation) from June 2022 until August 2024. In August it broke below this support level. Once the action moves back above this level we are ultra-bullish. That's it.
We can see the highest volume ever as prices start to recover. We are looking at a true bottom. From this point on, we can expect massive growth.
Notice the two sets of Fibonacci numbers as explained in a previous publication. Short-term and long-term targets.
Thanks a lot for your continued support.
We are only getting started. Notice that many pairs already moved strongly and these, while still early and great, should be ignored. If we are doing spot and we want to maximize potential profits, we have to dig a bit and find the ones that are yet to move. The ones that are already moving carry higher risk and a correction can develop any day.
When the correction develops, there won't be any warnings, it will just crash and thus buying near support regardless of what the rest of the market is doing. You can't go wrong by buying low.
Just a piece of friendly advice.
Namaste.
EWTUSDT trade ideas

Wolfe wave in five wavesHello guys, I've identified a wolf wave with good volume in the last drop, perfect for accumulation and an initial minimum price of $5.
Good Luck

Energy Web token with big divergenceGood day traders, this time I bring you a token that is leaving a weekly divergence in RSI, I start to accumulate positions because if this takes off it can give an exorbitant profitability. The area to beat to confirm a trend change is marked on the graph with the red block.
Good luck with your investments

EWTUSDT 1WEWT ~ 1W
#EWT If you have the courage this is a pretty good price to start buying. with a short term target of 20%++
This is risky, only for those of you who dare to take the risk.

EWT (Energy Web). Good news to grow for low liquidity assetENERGY WEB DEVHUB GMBH is excited to announce its participation in the new EU Horizon project, ECS4DRES. This consortium-driven initiative is set to span three years, during which Energy Web will gain valuable insights and benefits.
More details see proposal - archivio.unime.it

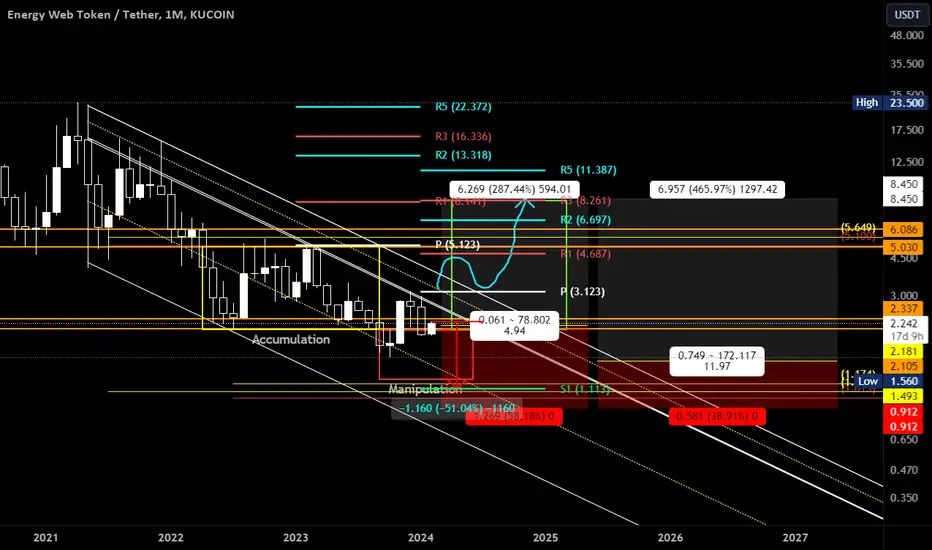
EWT/USDT Major trend. Channel -93% US Energy Sector 11 2023Logarithm. Time frame 1 week.
Cryptocurrency in coinmarketcap: Energy Web Token.
Of the liquid exchanges, it is traded on KuCoin, Kraken (USA), Gate.io.
Downward channel. At the zone of its meridian a descending wedge has formed in the secondary trend. The percentages to the key zones of support/resistance levels are shown on the chart. It is more rational to work from the average buy/sell price, as we are already in the first capitulation zone.
Decline from the low (liquidity) -93%.
We are in the first so-called capitulation zone.
This is not the maximum value for altcoins of such liquidity.
The range of the maximum capitulation zone is shown on the price chart, which is the range of the downward volatility channel and understanding of market cycles and chart logic, i.e. price movement.
Also shown on the chart are conventionally maximum averaged (from the average price) potential market phase targets (not "one-step" pump/dump due to low liquidity at good times, but specifically trends):
1) "participation" (bullish trend development towards the reset zone, i.e. distribution).
2) distribution. .
Capitalization is low. There is no HYIP (the project and the meaning is different), it is not a one-step profit from nothing. Suitable for investment if you understand "who and for what", will or will not be able to realize the intended (not speculation, because it is easier to simply under the "hamster time" given the liquidity) is another matter.
Fundamental basis . That is, what it is and what it is for.
This is a so-called real project. It is not created for cryptocurrency hype and speculation (money from nothing). Until everything is ready, then the price does not matter. In the project previously invested a large capital not speculative, but more far-sighted direction, which is interested exactly in the development of the project's intent in the field of energy and control in the United States in the first place, and not in speculation.
The Energy Web Token (EWT) is the operating token underlying the Energy Web Chain, a blockchain-based virtual machine designed to support and further develop applications for the energy sector. In times of blackout, it will be relevant.
The Energy Web Token is a joint project between Rocky Mountain Institute (RMI) and Grid Singularity (GSy).
Rocky Mountain Institute (RMI) is a leader in research and development in the energy sector. As a renowned think tank, RMI has been involved in many groundbreaking projects in the energy sector. By creating the Energy Web Chain, RMI wanted to harness the decentralized power of blockchain technology to enable participants in the energy sector to develop new decentralized solutions.
Grid Singularity ( GSy ) brought blockchain expertise to the project. As a blockchain developer, GSy was the driving force behind the creation of the Energy Web Chain. Together with renowned experts, key Ethereum blockchain developers, experienced energy executives and energy regulators, GSy was an integral part of the EWT launch.
Given that the Energy Web Chain network is designed for enterprise use , it supports state-of-the-art scalability and data privacy. The Foundation also recently released a comprehensive technology solution called the Energy Web Decentralized Operating System (EW-DOS). This allows users to monitor and manage their electrical systems online.
Line chart to visualize this downward channel and the logic of the wedges in it.
Secondary trend. Downward wedge zone. Time frame 3 days.

EWT/USDT Secondary trend. Downward wedge zone. 4 11 2023Logarithm. Downward wedge zone. Time frame 3 days.
A descending wedge is forming in the descending channel (the main trend). Almost in the final phase of its formation.
Decrease from the price minimum in the main trend -93%.
We are in the first zone of so-called capitulation.
This is not the maximum value for altcoins of such liquidity.
The range of the maximum capitulation zone is shown on the price chart, which is the range of the downward channel (main trend) of volatility.
Cryptocurrency in coinmarketcap: Energy Web Token.
From liquid exchanges traded on KuCoin, Kraken (USA), Gate.io.
Repeatability of fractal wedge logic (secondary trend) in the downward channel (primary trend).
Local resistance zones in the realization of the figure's goals after breaking through the resistance of the wedge (breaking the downward trend of price movement). Fractal projection on identical zones now.
Main trend (to understand the given zone of the wedge in it).
EWT/USDT Major trend. Channel -93% US Energy Sector 11 2023

RED LINESWe wait until the break of strong red resistance lines UP...
Consolidation above these lines can give good profit
WAIT & WATCH IT

$EWT Energy Web Token in a Falling Wedge ...Low risk Buy!AMEX:EWT Energy Web Token Price action has been in a falling wedge for over two years!
Current price: $2.6
Currently a very low risk buy! At its all time high, AMEX:EWT price action reached a height of approximately $23.
A break out of falling wedge will lead to resistances above: 3.1, 5.2, 7.7, 10.9, 14, 17, 19.5, 23.4

EWT this is the way EWT the most fundamentally sound project but still no hype
but wait the chit chat is just beginning after the Blackrock name has been associated with it so expect boom boom soon

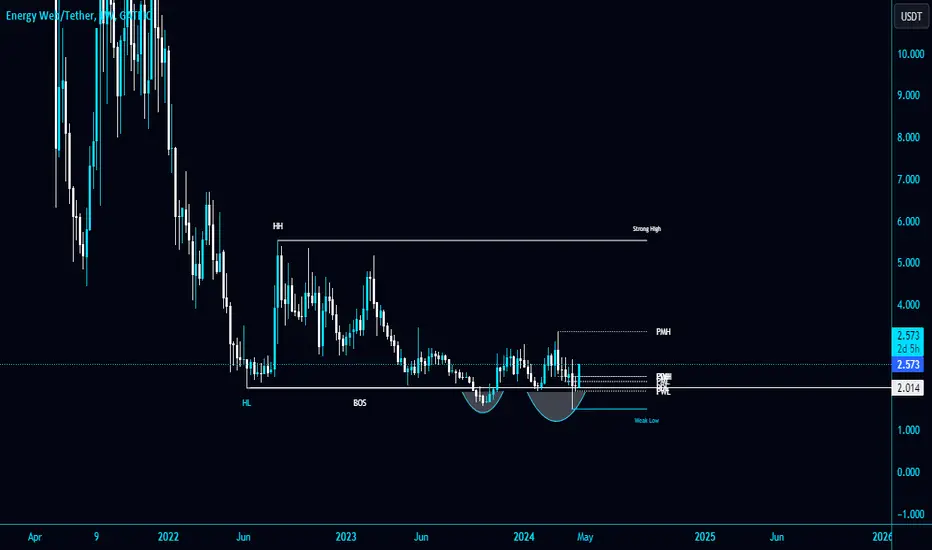
#EWT/USDT grabbed the liquidity below the strong support level#EWT/USDT grabbed the liquidity below the strong support level of $PWL $1.95 in Weekly TF!
AMEX:EWT hut the liquidity below it and now bouncing back. The local resistance level is PMH $3.36.
Bulls are coming in. Buying some in Spot.
Energy Web TokenAMEX:EWT broke out of Macro Trendline currently doing a Bullish R/S Flip.
Got me some today, expecting Bullish continuation from here.

#EWT long term idea Have been watching #EWT for past few months on higher time frame, price action is looking more and more interesting.
the way I am looking to trade this is ...
Buying 20% at here at mark price
remaining 80% will leave bids below with increasing sizes to get an average of approx. 1.25$
another plan is to buy the rest after we have downtrend channel breakout on monthly chart.
this is kind of coin that you should think 10 times before investing large sum, i am planning to risk only 2% of overall portfolio with it as stoploss is about 50% down 🫣🫣🫣
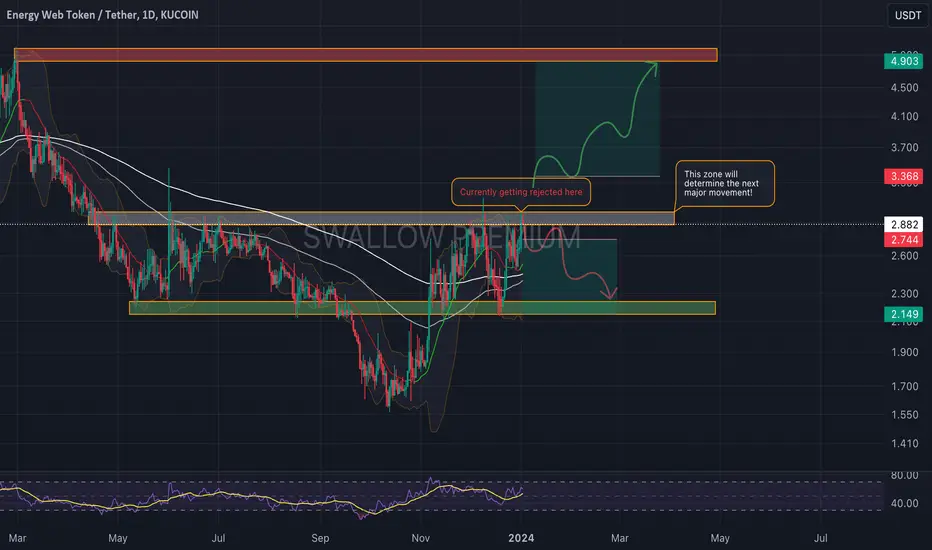
Energy Web Token(EWT): Currently At Major Resistance!ETW coins are near a major resistance zone where we are currently seeing some weakness (rejection). With just this being shown, we are looking for a potential rejection here, which could lead to a very short position for sure.
But if we see a nice breakout from current zones and the market price secures that same zone, we will see further bullish movement to the upper target zone.
The Falling channel of $EWT Energy Web Token - Low Risk buy?AMEX:EWT Energy Web Token has remained in a massive falling channel for months. Will it Rise? Low risk Buy opportunity?
Price action is currently at the upper range of it's falling Channel
@energywebx Current price: $1.96
I am biased on this one, It is one of my favourites..
CYPTOCAP:EWT #EWT Up Resistances: 2.06, 2.9, 3.8, 4.8, 5.6, 6.6, 7.7, 8.8, 9.6, 10.7

This is the literal BOTTOM for Energy Web Token (EWT)EWT has broken out of a 2.5 year downtrend which markt the literal bottom if I know anything about TA.
Focus on Renewable Energy
EWT aims to accelerate the adoption of renewable energy sources by creating a decentralized platform where energy assets can be easily and transparently operated. Given the increasing importance of green energy, this sector-specific focus could give EWT a unique edge.
Strong Partnerships
Energy Web Token has built partnerships with prominent players in the energy sector. This not only provides it with credibility but also helps in real-world adoption, which is a key metric for any cryptocurrency.
Not financial advice.

EWT Energy Web Token a low risk buy...#EWT has remained in a massive price range (btw $2.2 - 5.2) for 15months
Price action is currently at the Bottom of the Range - Forming a Double Bottom!
@energywebx Current price: $2.7
All time High for AMEX:EWT : $22.2
Currently a low risk buy ...

Total MC exc. BTC vs $EWTA quick chart showcasing the total crypto market cap excluding BTC vs your favorite altcoins. In this case, Energy Web Chain.

EWT buying from the bottom of the range.Risk income 1k3, investment horizon 8-12 weeks, buyer activity from the bottom of the range.
One target of +60% at -20% risk

LAST Buying Opportunity For ENERGY WEB TOKENEWT or Energy Web token has reached its bottom.
Do you have the balls to buy?


EWT/USDT- The breakout you do not want to miss. Great Setup for Energy Web Token-
If it can break the indicated level and flip resistance to support there could be some substantial gains to be made.
(A small break followed by a supported retest would be a major indicator for me and create the ideal setup)
Alternately if BTC continues to dip there should be some really good entry price options over the next month by simple DCA in the historic support zones.
If BTC plays friendly some high targets will come into play.
Keep an eye on it.
As always just my thoughts and TA,
Feedback Welcomed.
Bingaz.

i found W partten my trade buy now and sell at 5.5 soon my way i found W partten my trade buy now and sell at 5.5 soon my way
