Flow: Your Altcoin ChoiceBefore starting, I want to show you the linear chart for FLOWUSDT. I always use the log. chart to be able to see the high and lows and the candles more clearly.
When the candles become flat and almost invisible, it means the market is trading at bottom prices. This is FLOWUSDT long-term:
This app

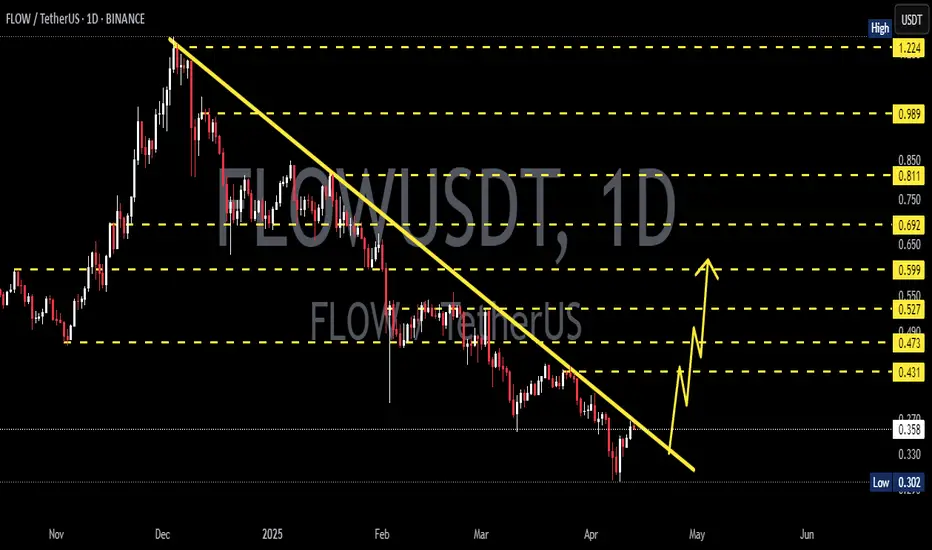
FLOWUSDT 1DFLOW ~ 1D Analysis
#FLOW Buy gradually after successfully penetrating this resistant line with a short -term target of at least 10%+.
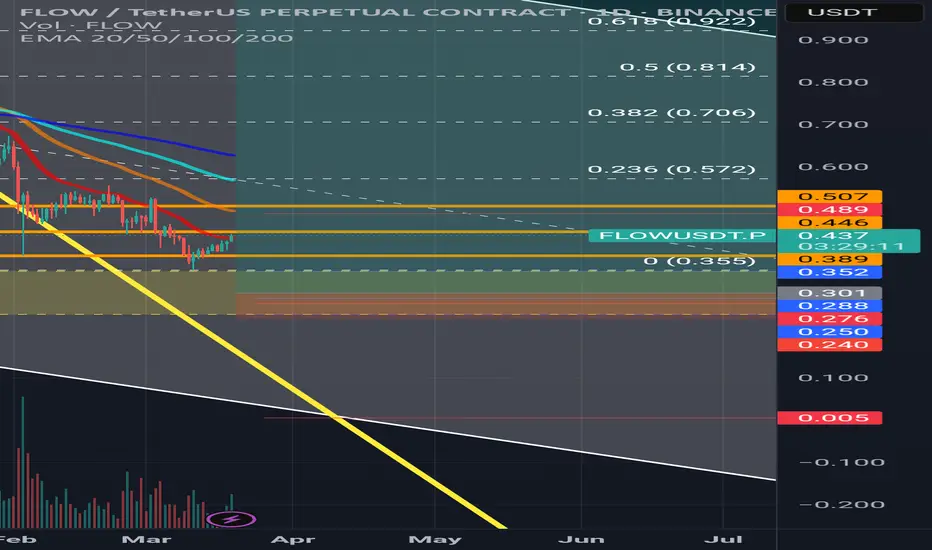
Flowusdt.pHello friends
We will have the analysis of the currency flow, stay with me
We have 3 entry points in a stepwise manner
0.352
0.288
0.25
But the targets for saving profit
1.668
4.331
18
Please observe capital management, our view for this coin is medium and long term
Be successful and profitable🌹
FLOW/USDT 1W🩸 EURONEXT:FLOW ⁀➷
#Flow. Macro chart Another
💯 Intermediate Target - $2.90
🚩 Macro Target 1 - $4.00
🚩 Macro Target 2 - $6.30
🚩 Macro Target 3 - $9.36
- Not financial advice, trade with caution.
#Crypto #Flow #FLOW #Investment
✅ Stay updated on market news and developments that may influence

FLOWUSDT 6DFLOW ~ 6D Analysis
#FLOW This is the lowest support block for now. Buy from here with a minimum target of 20%+.

FLOW can fly#FLOW is on its demand before that made an ABC pattern with a triangle at the middle of it its a correction structure so now its a good time for this coin to rise !

FLOWUSDT 1WFLOW ~ 1W Analysis
#FLOW In Time Frame 1W re -test this support, buy from here if you still have a conviction on this coin with a minimum target of 20%++

SPOT FLOW LONG 21.01.2025Pinning after containment of sales.
🎯Purpose:
0.877
I'll let you know when I record it manually.
‼️Risk per trade: 1% of the allocated funds for spot trading.

#FLOW (SPOT) IN ( 0.600- 0.750) T.(6.900) SL(0.556)BINANCE:FLOWUSDT
#FLOW/ USDT
Entry ( 0.600- 0.750)
SL 1D close below 0.556
T1 1.100
T2 1.550
T3 2.600
T4 4.100
T5 6.900
______________________________________________________________
Golden Advices.
********************
* collect the coin slowly in the entry range.
* Please calculate your losse

$FLOW - ON THE RUNWAY!The big wave 1 of FLOW created a BOS that broke the previous long-term downtrend. After this break, the price returns to the previous cumulative area test and is signaling back to the upward momentum from today!
The accumulation phase is 5 months long (from June - November), if you zoom in on the c

See all ideas
Summarizing what the indicators are suggesting.
Oscillators
Neutral
SellBuy
Strong sellStrong buy
Strong sellSellNeutralBuyStrong buy
Oscillators
Neutral
SellBuy
Strong sellStrong buy
Strong sellSellNeutralBuyStrong buy
Summary
Neutral
SellBuy
Strong sellStrong buy
Strong sellSellNeutralBuyStrong buy
Summary
Neutral
SellBuy
Strong sellStrong buy
Strong sellSellNeutralBuyStrong buy
Summary
Neutral
SellBuy
Strong sellStrong buy
Strong sellSellNeutralBuyStrong buy
Moving Averages
Neutral
SellBuy
Strong sellStrong buy
Strong sellSellNeutralBuyStrong buy
Moving Averages
Neutral
SellBuy
Strong sellStrong buy
Strong sellSellNeutralBuyStrong buy
Displays a symbol's price movements over previous years to identify recurring trends.