FLOWUSDT"As we enter the bullish season, the initial target to aim for is
target : 8.7 15.0 🎯.
This is based on a combination of technical analysis indicators and market trends.
However, it's important to approach trading with caution and adapt to changing market
conditions.
Keep an eye on key support and resistance levels, as well as any significant news or events that may impact the market.
Remember to use proper risk management techniques and consider setting profit targets along the way.
Happy trading!"
FLOWUSDT.P trade ideas

🔥FLOW Break The 800-day Wedge: What Targets Next❓Flow fell by -99% from the ATH. This is a massive liquidation and capitulation of holders. I think it's time to recover.
Now the price broke the 800-day(!) wedge and grew by +50% in 4 weeks.
💥 What targets next? The closest local targets at $1 and $1.45. The glovbal targets are on chart.
like❤️ and follow
Check the links and get a BONUS🎁 from me👇

Flow in the accumulation zone!!!The price is still in the Global accumulation zone, as soon as it leaves it beyond the level of 0.703 with consolidation, this will mean the beginning of global growth of the asset!!!
The purchase levels under the "Impulse" strategy were:
Global 0.413
Local 0.410
Buy zone 0.497-0.348, level 0.416
I don't see the strength yet! it is possible to return to the zones: Local 0.560-0.311 and Purchases 0.497-0.348!
The price of the total volume is 0.445 - for those who do not remember, or do not know!
This is the average price of the largest traded volume, and since the price is at the bottom, it is (the average price of the accumulated position at the moment)
Good hunting to all!!!

FLOW| correction and exit from the channel is approaching!Hello trader! Today I have a new idea for you. Like and subscribe to the channel, there is a lot of useful information there.✅
After a long upward movement, the price has been consolidating in one range for several days now at $0.5-0.6, I think that preparations are underway for a correction.
Deal plan:
Entry - 0.525/0.545$
Stop - $0.578
Take - $0.454
Guys, try to be careful, the coin’s volatility can creep up at any moment, please be aware of the risks!

my target of flowEURONEXT:FLOW ON BINANCE
📍Entry: 0.0433
📍REBUY: 0.0413
💰1 Take Profit: 0.51
💰2 Take Profit: 0.7
💰3 Take Profit: 1
💰4 Take Profit: 1.34
🚫 Stop Loss: Without
Pattern Swing - Trends should hold daily

FLOWUSDT Eliott Waves AnalysisHello friends.
Please support my work by clicking the LIKE button👍(If you liked). Also i will appreciate for ur activity. Thank you!
Everything on the chart.
Entry: market and higher
Target/ Reversal zone: 0.3 - 0.2
after first target reached move ur stop to breakeven
Stop: (depending of ur risk). ALWAYS follow ur RM .
Good luck everyone!
Follow me on TRADINGView, if you don't want to miss my next analysis or signals.
It's not financial advice.
Dont Forget, always make your own research before to trade my ideas!
Open to any questions and suggestions

The key is whether the price can be maintained above 0.435Hello?
Hello traders!
If you "Follow" us, you can always get new information quickly.
Please also click “Boost”.
Have a good day.
-------------------------------------
(FLOWUSDT.P chart)
(1D chart)
The key is whether it can receive support in the 0.414-0.443 range and rise above 0.454.
(1h chart)
To do so, we need to check whether it can receive support in the 0.427-0.434 range and rise above the 0.434-0.452 range.
If the price is maintained above the 0.432 point, which is the standard for the 0.434-0.452 range, attempts to rise are expected to continue.
At this time,
1st: 0.438
2nd: 0.447
3rd: 0.452
A response is needed depending on whether support or resistance is received around the 1st to 3rd positions above.
If it rises to the 0.449-0.470 range, there is a high possibility of resistance, so I think it is a good idea to choose whether to continue trading or check the flow after liquidation.
-------------------------------------------------- -------------------------------------------
** All explanations are for reference only and do not guarantee profit or loss in investment.
** Trading volume is displayed as a candle body based on 10EMA.
How to display (in order from darkest to darkest)
More than 3 times the trading volume of 10EMA > 2.5 times > 2.0 times > 1.25 times > Trading volume below 10EMA
** Even if you know other people’s know-how, it takes a considerable amount of time to make it your own.
** This chart was created using my know-how.
---------------------------------

FLOWUSDT POSSIBLE BEARISH AND FAKE BREAKOUTFLOWUSDT POSSIBLE BEARISH AND FAKE BREAKOUT
Many liquidity to be grabbed and and OB to be filled. possible fake breakout . The price will garb liquidity before going down for a retest. you should Wait for a retest and a reversal bar to confirm up breakout otherwise ,the price will have a high probability to reach the bullish OB.
Good LUck

flow (flowusdt) wait fo buyThis currency forms a triangular pattern, and is also considered a flag. After breaking the ceiling and receiving withdrawal confirmation, we can enter into the purchase transaction

FLOW risk/reward ratio 161D time frame
-
FLOW just got rid of the long-term downtrend and is making a small triangle structure now.
This triangle could be a continuation structure, which help us to set up a trading plan. Also, using Fibonacci extention on the falling wave(1.444~0.408), there are two major resistance zones, where are proper targets. SL is set below previous low, then we can gain a great risk to reward ratio over 16.
TP: 1.326~1.444 / 1.873~2.084
SL: 0.379

FLOWUSDT (Daily) - Bullish reversalHi Traders
FLOWUSDT (Daily Timeframe)
Waiting for the upward break of 0.4910 resistance level, which will complete a bullish trend reversal pattern to go LONG. Only the downward break of 0.3900 would cancel the bullish scenario.
Trade details
Entry: 0.4910
Stop loss: 0.3900
Take profit 1: 0.5530
Take profit 2: 0.6540
Score: 4
Strategy: Bullish reversal

FLOW Just Broke Descending Channel | Flow Bullish Momentum 💎 Paradisers, get ready for an electrifying chance with FLOWUSDT! Having recently shattered its descending channel trend line, the asset is in the process of retesting this level, paving the way for a potential bullish leap.
💎Just a few days ago, FLOW sketched a sturdy descending channel, making contact with the trend line on several distinct occasions before finally breaking itself.
💎What ignited this breakout? Our deep dive into the High Time Frame (HTF) weekly chart unveils a bullish weekly candle, indicative of powerful buying momentum.
💎The volume profile is equally telling, showing fluctuations that correspond with the range of the candle. This retest could serve as a prime trading gateway.
💎However, if the FLOW plunges below the trend line, brace yourself for a considerable downward trajectory. In such an event, strategize your short positions meticulously.
💎Stay on the cutting edge and trade wisely!

FLOW 24% LONG Movement I suppose, that flow will be moving very high for this week. Around 24% of long movement.

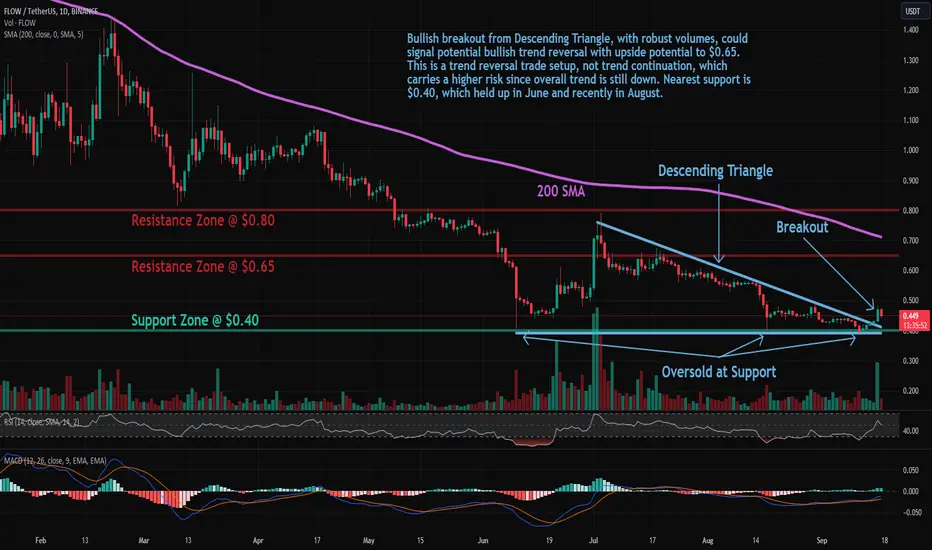
FLOW: Descending Triangle BreakoutTrade setup : Bullish breakout from Descending Triangle, with robust volumes, could signal potential bullish trend reversal with upside potential to $0.65. This is a trend reversal trade setup, not trend continuation, which carries a higher risk since overall trend is still down. Nearest support is $0.40, which held up in June and recently in August.
Trend : Neutral on Short-Term basis and Downtrend on Medium- and Long-Term basis.
Momentum is Mixed as MACD Line is above MACD Signal Line (Bullish) but RSI ~ 50 (Neutral).
Support and Resistance : Nearest Support Zone is $0.40. The nearest Resistance Zone is $0.65, then $0.80 and $1.10.
FLOWUSDTAnother x,y melting here, I think the break is completed. There may be sharp increases to the points realized after the trend break. The visual is for illustrative purposes only.

FLOWUSD (Daily) - Bearish breakoutHi Traders
FLOWUSD (Daily Timeframe)
The market is in a downtrend and we are waiting for an entry signal to go SHORT below the 0.3940 support level. Only the upward break of 0.4910 would cancel the bearish scenario.
Trade details
Entry: 0.3940
Stop loss: 0.4910
Take profit 1: 0.3340
Take profit 2: 0.2370
Score: 8
Strategy: Bearish breakout

FLOW on the short list with the level of 0.442Hello everyone!!!
AIHermes today identified the coin FLOW on the short list with the level of 0.442
Entry model - breakout! Leverage 10-20X
Stop short.
1st target - 0.394
Trade with us, trade better than us!
Today:
18 coins on the short list
12 coins on the long list

FLOWUSDT (4H) - Bullish reversalHi Traders
FLOWUSDT (4H Timeframe)
Waiting for the upward break of 0.4814 resistance level, which will complete a bullish trend reversal pattern to go LONG. Only the downward break of 0.4353 would cancel the bullish scenario.
Trade details
Entry: 0.4814
Stop loss: 0.4353
Take profit 1: 0.5114
Take profit 2: 0.5585
Score: 6
Strategy: Bullish reversal

FLOWUSD ❕ ready to reboundTD Sequential formed an up reversal signal (1H TF)
RSI indicates that the initiative is shifting to the buyers.
The asset is ready for a rebound and will start it after fixing above the resistance level.

FLOW FLOWUSDT Price Analysis (1D)Hello there, fellow traders!
Let's dive into a detailed analysis of FLOWUSDT's current state and explore the potential for an upcoming accumulation phase. The Daily timeframe revealing a substantial -98% drop in price, showcasing significant volatility.
What grabs our attention is the consistent downward resistance line that has been a dominant force since mid-2021. This line has been touched four times, highlighting the weakening selling pressure and hinting at an evolving trend.
Amidst this, a pattern emerges – the Falling Wedge.
This pattern forms as the downward resistance converges with a support line. The repeated touches on the resistance coupled with a converging support suggest a potential shift in momentum, which is often a precursor to accumulation.
Zooming in, we find a crucial support at $0.44 , a level that holds immense significance. Our analysis marks out key targets and resistance levels at $0.65, $0.81, and $1.19 . These levels represent critical junctures, offering potential challenges and opportunities.
Now, let's talk about the RSI indicator – a tool that gauges market sentiment. The RSI has ventured into the oversold zone, signaling a potential shift in momentum. This aligns perfectly with our theory of an impending price bounce. It's like a green light blinking, suggesting that a price rebound might be on the horizon.
In our trading journey, patterns and indicators guide us, but it's vital to remember the anchor of risk management. Each trade teaches us something, regardless of the outcome.
As we venture into the twists and turns of FLOWUSDT's path, let's continue our pursuit of knowledge, flexibility, and sound decision-making. Trading is a puzzle, and we're piecing it together one step at a time. Happy trading and may the patterns be ever in your favor! 📈🚀

FLOWUSDT (4H) - Bullish reversalHi Traders
FLOWUSDT (4H Timeframe)
Waiting for the upward break of 0.573 resistance level, which will complete a bullish trend reversal pattern to go LONG. Only the downward break of 0.550 would cancel the bullish scenario.
Trade details
Entry: 0.573
Stop loss: 0.550
Take profit 1: 0.587
Take profit 2: 0.610
Score: 5
Strategy: Bullish reversal

FLOWUSDT Poised for Explosive Upside Move💎👀💎Recent Price Action: FlowUSDT has been showing promising signs of a bullish move, with notable volume buying observed in the market. The price has been consolidating, indicating a potential buildup of positive momentum.
💎 Volume Surge: The surge in buying volume suggests growing interest and confidence among traders. This could be a strong indicator of an upcoming bullish move.
💎Breakout from Trendline: Flow has recently broken out from a key trendline, showcasing a significant price movement. If the price successfully sustains above this breakout point, it could trigger a series of positive price actions.
💎 Liquidity Grab Level: Keep a close eye on the liquidity grab level. If it manages to surpass this level following the breakout, it may indicate a strong upward surge in price.
💎 Potential Upside: Considering the high volume buying, breakout from the trendline, and liquidity grab level, it appears poised for a potential bullish move. Traders are advised to monitor the price closely for any signs of confirmation.

