1.37 RR or 4.5 RR2 different trades possible, better RR has higher risk of missing entry, but is overall safer and more profitable. I'll go with this and modify my position if it bounces convincingly sooner

FORTHUSDT Analysis: Monitoring Key Buyer Zones My previous analysis on FORTHUSDT was spot on, as you can see in this link: FORTHUSDT: Sniper Entry +%26 Reaction .
Currently, we still have buyer interest , but the overall market conditions are weak . If the first blue box is lost, I will avoid any entries until the lower blue box , which

FORTHUSDT | Huge Volume IncreaseVolume Surge: FORTHUSDT has experienced a significant increase in trading volume.
Key Points:
Blue Boxes: Identify potential zones where buyer activity may pick up.
Conclusion: The notable rise in volume signals growing interest. Keep an eye on the blue box areas for potential entry points where

FORTHUSDT | %800 DAILY VOLUME SPIKE HUGE OPPORTUNITYFORTHUSDT Analysis Update
We are observing an 800% increase in volume on FORTHUSDT, buyers are active but I will still wait good prices. I think I can get my profits from here as long as the market doesn't go too bad.
Long trades can be planned based on the reactions in the lower time frames near

#FORTH (SPOT) entry range( 2.600- 3.170) T.(5.450) SL(2.517)BINANCE:FORTHUSDT
entry range( 2.600- 3.170)
Target1 (4.246) - Target2 (5.450)
1 Extra Targets(optional) in chart, if you like to continue in the trade with making stoploss very high.
SL .1D close below (2.517)
*** collect the coin slowly in the entry range ***
*** No FOMO - No Rush , it is a lo

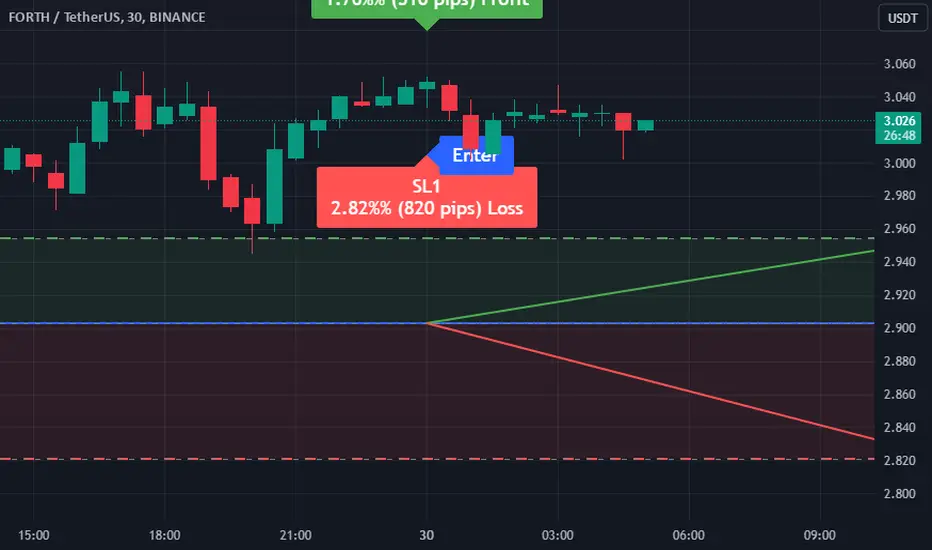
Trade Signal for FORTH/USDTDirection: Buy
Enter Price: 2.903
Take Profit: 2.954
Stop Loss: 2.821
We have identified a promising opportunity for the FORTH/USDT currency pair using the EASY Quantum Ai strategy. The parameters suggest a bullish movement, warranting a "Buy" position. Here's our analysis:
1. Mark
FORTHUSDT Trading Signal: Sell OpportunityAttention traders! We have a new trading signal for the FORTHUSDT pair based on the EASY Quantum Ai strategy. Here are the details:
Direction: Sell
Enter Price: 3.165
Take Profit: 3.11233333
Stop Loss: 3.25833333
Our EASY Quantum Ai strategy has identified a potential downward move

Trade Signal for FORTHUSDT: Sell OpportunityAttention traders! Our analysis using the EASY Quantum Ai strategy has identified a potential Sell opportunity for the FORTHUSDT currency pair.
Enter Price: 3.165
Take Profit: 3.11233333
Stop Loss: 3.25833333
Several factors contribute to this forecast. Firstly, our strategy has detec

FORTHUSDT.4HUpon analyzing the FORTH/USDT 4-hour chart, here’s my detailed breakdown based on the displayed technical indicators and chart patterns:
Key Resistance and Support Levels:
Resistance 1 (R1) at $3.634: This is an immediate ceiling where the price has struggled previously. Overcoming this resistance

Alikze »» FORTH | Descending channel🔍 Technical analysis: Descending channel
- The 4H frame time is moving in a descending channel.
- Currently, in a limited range, the rangeing of a corporate pattern can have a downward refinement by testing the area.
- Therefore, if it is exposed to a sales pressure after colliding with a dynam

See all ideas
Summarizing what the indicators are suggesting.
Oscillators
Neutral
SellBuy
Strong sellStrong buy
Strong sellSellNeutralBuyStrong buy
Oscillators
Neutral
SellBuy
Strong sellStrong buy
Strong sellSellNeutralBuyStrong buy
Summary
Neutral
SellBuy
Strong sellStrong buy
Strong sellSellNeutralBuyStrong buy
Summary
Neutral
SellBuy
Strong sellStrong buy
Strong sellSellNeutralBuyStrong buy
Summary
Neutral
SellBuy
Strong sellStrong buy
Strong sellSellNeutralBuyStrong buy
Moving Averages
Neutral
SellBuy
Strong sellStrong buy
Strong sellSellNeutralBuyStrong buy
Moving Averages
Neutral
SellBuy
Strong sellStrong buy
Strong sellSellNeutralBuyStrong buy