Frontier (FRONT) a setup for upto 19.50% pumpHi dear friends, hope you are well, and welcome to the new update on Frontier (FRONT) token.
Previously we caught almost 19% pump of FRONT as below:
Now on a daily time frame, FRONT with Bitcoin pair is about to complete a bullish Shark move for the next price reversal move.
Note: Above idea

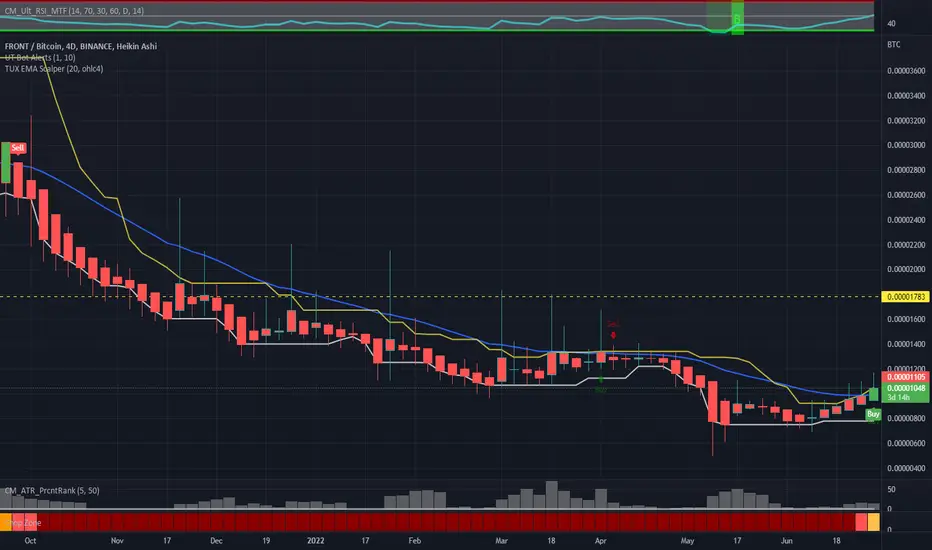
✳️ Frontier, Bottom Confirmed (560% Growth Potential)Frontier came out recently out of a 5 months long rounded bottom. After the initial bullish wave that peaked September we have a test of EMA50 as support. As FRONTBTC moves weekly above this level, growth potential is fully confirmed.
Matched by a strong RSI, again on the weekly timeframe which tel

$FRONT/#BTC [#Frontier]: BBand_Breakout Resistance_Breakout◳◱ Hey crypto lovers, we've identified bullish signals on the $FRONT / $BTC chart through the detection of both a Bollinger Band and a Resistance Breakout. The Bollinger Band indicates a potential bullish trend as the price has moved outside of the upper band, while the Resistance Breakout confirms

Frontier (FRONT) formed bullish Gartley for upto 13% pumpHi dear friends, hope you are well, and welcome to the new update on Frontier (FRONT) token BTC pair.
Previously we had a nice trade of FRONT:
Now on a 4-hr tiem frame, FRONT has formed a bullish Gartley pattern.
Note: Above idea is for educational purpose only. It is advised to diversify and

Can FRONT Start to PUMP?FRONT is also holding strong like other coins did before they pumped
This is just a signal
Frontier High Volume Breakout (Daily & Weekly)Several weeks ago I mentioned that the Altcoins move together...
What one does, the rest follows.
We saw some Altcoins printing 2-3 digits growth in one single day...
Now we have many Altcoins that are doing the exact same.
FRONTBTC (Frontier) has joined the game.
Very strong volume today... Add

$FRONT looking to reverse its BTC trendBullish diversion after months of bleeding. Area of support. Looking at possible entries.

$FRONT/BTC 2D (Binance Spot) Falling wedge on supportFrontier is looking interesting here for a bounce towards 100EMA and maybe even a bullish breakout after.
More information about that DeFi / BSC token on frontier.xyz
Current Price= 0.00002127
Buy Entry= 0.00002125 - 0.00001905
Take Profit= 0.00002617 | 0.00003335 | 0.00004160
Stop Loss= 0.00001614

$Front cup & Head on 1DBullish cup & head in play on 1D in front btc pair ! if this ages well massive up side moves coming !
ps:- NFA ! this is my observation ! thanks

$Front Making cup & Head on 1DFrontier is a super cool project on which am super bullish . making bullish cup and head on 1D ! if this played out and the resistance of 0.00003872 broken there will be sharp up side moves !

See all ideas
Summarizing what the indicators are suggesting.
Oscillators
Neutral
SellBuy
Strong sellStrong buy
Strong sellSellNeutralBuyStrong buy
Oscillators
Neutral
SellBuy
Strong sellStrong buy
Strong sellSellNeutralBuyStrong buy
Summary
Neutral
SellBuy
Strong sellStrong buy
Strong sellSellNeutralBuyStrong buy
Summary
Neutral
SellBuy
Strong sellStrong buy
Strong sellSellNeutralBuyStrong buy
Summary
Neutral
SellBuy
Strong sellStrong buy
Strong sellSellNeutralBuyStrong buy
Moving Averages
Neutral
SellBuy
Strong sellStrong buy
Strong sellSellNeutralBuyStrong buy
Moving Averages
Neutral
SellBuy
Strong sellStrong buy
Strong sellSellNeutralBuyStrong buy
Displays a symbol's price movements over previous years to identify recurring trends.