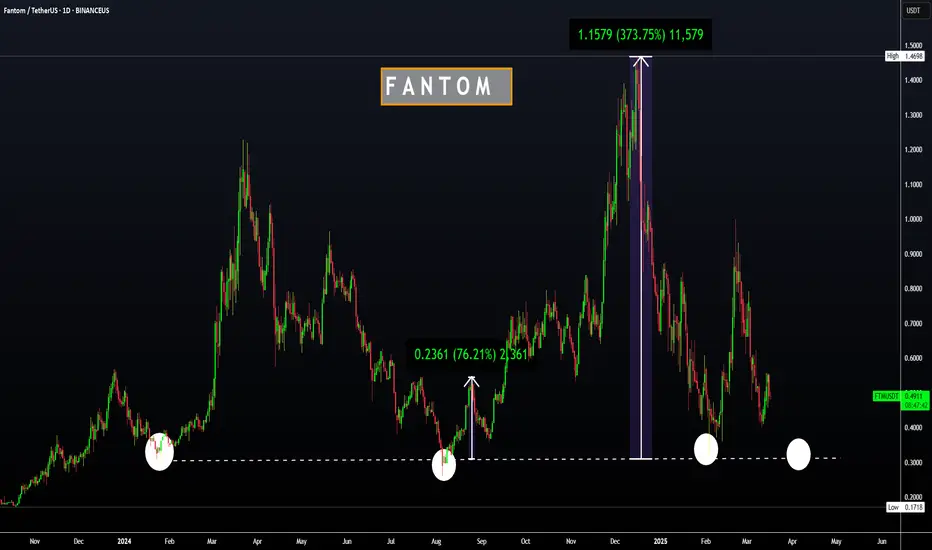
FTM | FANTOM | Altcoin with GREAT UPSIDE POTENTIALFTM has recently increased 11% in the weekly, but is making more red candles in the daily and the impulse up seems to be over for now.
Looking at the corrections, from -45% to -80% is not uncommon for Fantom.
The good news, is that the bottom is likely close - and from here, there exists great upside potential.
I am NOT saying we can't fall lower here - infact, a full retracement may be likely, just as we saw the previous cycle. In which case, the upside is even bigger. 30c is indeed a very popular demand zone:
_____________________
BINANCEUS:FTMUSDT
FTMUSDT trade ideas
SONIC ( PRE FTM )Analysis of the FTM OR Sonic currency
It seems that a trend reversal has formed and has completed 5 microwaves in the form of a larger wave 1
Next we need to see if it can break the major ceiling to confirm the new move
If you liked the analysis, share it with your friends and write down your comments

Time Analysis For FTMUSDTThe temporal analysis performed on FTMUSDT indicates a positive movement to date
It can be hold by capital management.

Can FTM/Sonic Maintain Bullish trend?Can FTM/S Maintain Bullish trend?
Curious to hear your toughts on this.

FTMUSDT BULISHFTMUSDT IS TRYING TO BE BULISH AGAIN IN THIS TIME, SOME OF TARGETS ARE ALREADY REACHED AND THAT PRICE POINTS CAN BE THE CORRECTION LEVELS IN THE FUTURE.
PAY ATTENTION TO STOP LOSS AND DANGER ZONE PLEASE.
Note: My ideas are not intended for any type of scalping or scalpers!
You can find the full list of my ideas here: www.tradingview.com
Here are some of my ideas:

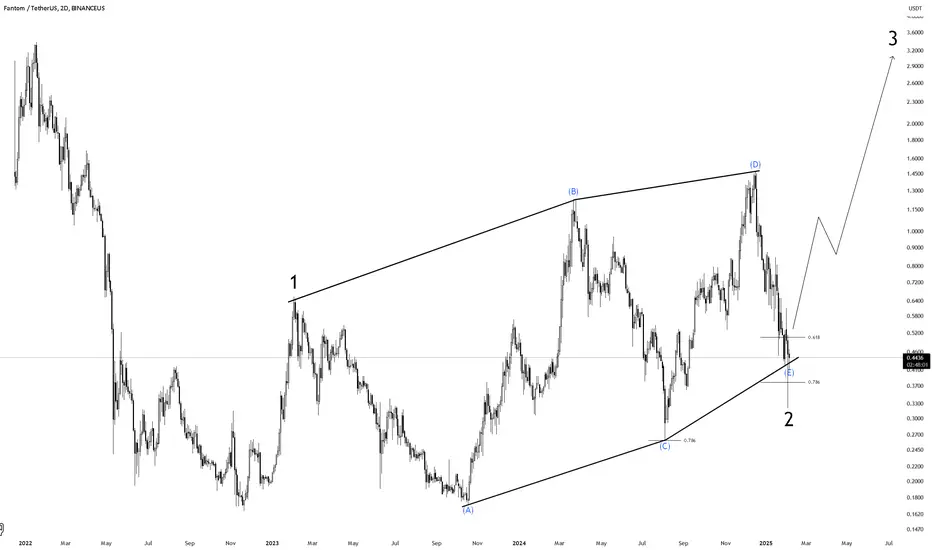
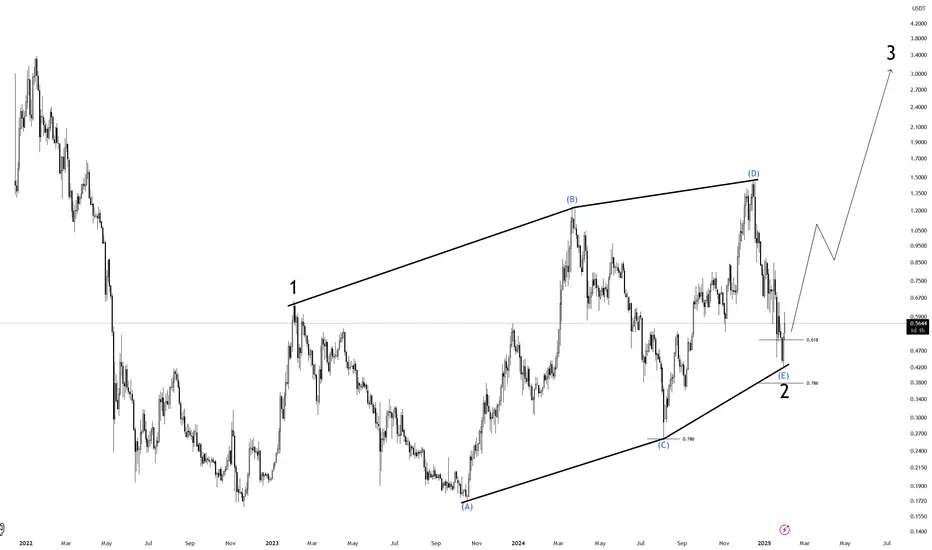
FTM update#FTM in long term has a clear pattern of correction the market made an ABCDE pattern and now its completed just waiting for the rise !
in last months this coin made good fundamental news like improving its net and turning into S but S chart is low on data so we can make long term analysis only on FTM
check out our last analysis on this coin in lower time frames
#FTM daily timeframe update#FTM DAILY TIMEFRAME UPDATE (ON DEMAND)
Fantom (Migrated to Sonic)
Fantom is a directed acyclic graph (DAG) smart contract platform providing decentralized finance (DeFi) services to developers using its own bespoke consensus algorithm.
ANY THOUGHTS ON UPCOM:FTM ?

FTMUSDT BULISH"FTM, like some others, has started a slow upward movement. Let’s observe its progress in the future.
The targets, danger zone, and stop loss levels are marked on the chart. Please pay close attention to all of them when managing your positions.
Note: My ideas are not intended for any type of scalping or scalpers!
You can find the full list of my ideas here: www.tradingview.com
Here are some of my ideas:

FTM ready to Go-Break out of the downtrend has been completed One of the best strategies, breakout of the down trend and retest it.
Strengths Points: one week candle has broken the blue down trend and it may continue to enter the white wide range, also reverse head and shoulders pattern formed
Target points and Stop Loss are marked on the chart.
I am Just sharing insights and market trends for learning and growing every day and it is not financial advice.

FTM LONG TERM update#FTM in long term has a clear pattern of ABCDE as a correction and now its a good time to buy it because its in its lowest price in the trend and also this coin clear all the liq below also has a good demand with fibo levels too !
FTMUSDT BULISH AGAINAfter the significant decline in the market a few days ago, including FTMUSDT, I can now see bullish signals for FTMUSDT. The targets are marked on the chart as always.
Note:
If the close candle passes the ‘Danger Zone,’ please be cautious with your positions.
If the close candle passes the ‘Stop Loss,’ exit this position, as it is no longer valid.
Note: My ideas are not intended for any type of scalping or scalpers!
You can find the full list of my ideas here: tradingview.com/u/TheMandalor/
Here are some of my ideas:

FTMUSDT-TO-SUSDT Chart From The BeginningFriends, please look at the base trend line coming from the beginning. It also shows that the support value will be 0.26 Dollar around in THESE DAYS (18-40 Days). Besides that targets are on the chart according to the parallel speed and resistance lines going upward. Supports are too, on the chart. Let's see how such a name changing absurd will result. If I were FTM Project- lab owners, I had preferred ''Fantom'' as a name instead SONİC and wouldn't change.

ACCUMULATE One day, a boastful rabbit challenged a slow tortoise to a race. Confident, the rabbit sprinted far ahead but grew cocky and stopped to nap, thinking the tortoise stood no chance.
Meanwhile, the tortoise kept moving steadily, never stopping. By the time the rabbit woke up, the tortoise was crossing the finish line.
The rabbit was stunned, and the tortoise simply smiled. “Slow and steady wins the race,” she said, proving that persistence beats overconfidence every time.

Fantom (FTM) to print 18,000% move in 2025 to $150 ??** This is a year long forecast **
On the above 10 day chart price action has corrected 70% from the highs of early 2021. A number or reasons now exist for a bullish outlook. They include:
1) Price action and RSI resistance breakouts.
2) Trend reversal. Higher highs higher lows confirm the end of the downtrend.
3) The bull flag. Have drawn this flag in a number of different ways to capture the last 3 years of price action. The red and blue arrows capture the optimum confluence. If you find a higher count, let me know in the comments below.
4) A 18000% move to $150 will print should the bull flag repeat the 1st impulsive wave. Look left, corrections of up to 80% should be expected along the way!
5) First resistance is at $3 as indicated by the inverse head and shoulders.
Is it possible price action continues to correct? Sure.
Is it probable? No.
Ww
Type: trade
Risk: you deicide
return: 18000% or 180x projected.

FTMUSDT BULISH FTMUSDT is looking bullish after a significant bearish period, and I believe the targets are quite achievable. I’m confident about most of them!
Here are my other ideas:

FTM update#FTM can make another drop before its huge rising i think its better to be out of market for a while and let the market do whatever it wants after hitting the confirmation level we can buy as much as we can !

FTM long term update#FTM made a rising pattern in long term
wave 1 is made the wave 2 is like ABCDE which is completed now the market is heading to the 3rd wave this can make the market reach its last highs in past
there was a huge liq at the bottom of the chart which the market took it i think there is no reason for going down again !

ftmI think it's a good place to buy in the lower areas as long as the red lines aren't broken in the short term.

Fantom- 300% ProfitDear Traders,
chart show one more upward to Double lines,
after Final Correction of BTC , You can Take position or buy ,
Final Target : 1.05>
If you enjoyed this forecast, please show your support with a like and comment. Your feedback is what drives me to keep creating valuable content."
Regards,
Alireza!

Ascending after reaching the bottom of the channelIn the daily time, it is close to the bottom of the channel, which is around the price of 0.55 after the collision The upward trend begins


FTMUSDT.1DFTM is currently in a corrective phase after a significant rally that tested the upper resistance (R2). The long-term trend remains upward, as indicated by the diagonal resistance trendline (R2) and higher lows formed over the past several months. However, the current pullback places the price in a consolidation zone, where market participants are deciding the next direction.
The support trendline (S1) is holding well, forming a strong base around the $0.5220 level, while the price is struggling to breach the critical horizontal resistance (R1) at $1.2218.
Support & Resistance Levels
Key levels to monitor include:
Resistance 1 (R1): $1.2218, a strong rejection zone from previous highs. This area must be decisively broken to confirm a bullish continuation.
Support 1 (S1): $0.5220, a robust support that aligns with the lower boundary of the consolidation range.
Support 2 (S2): $0.2537, a historical low and the last line of defense in case of further downside pressure.
Technical Indicators
MACD (12,26,Close):
The MACD line is below the signal line and trending in negative territory, which indicates bearish momentum is still present.
However, the histogram is showing signs of contraction, suggesting a potential shift in momentum.
RSI (14,Close):
The RSI is at 38.77, nearing oversold conditions. This suggests selling pressure is weakening and the price could be due for a reversal.
A move above the 50 level will confirm a bullish recovery.
Price Action & Patterns
FTM is currently trading within a rectangular consolidation range, with resistance at $1.2218 and support at $0.5220. This pattern suggests indecision, where the market is waiting for a catalyst to break out of this range.
The upward arrow indicates a potential bullish breakout scenario if buyers regain control, targeting R1 and potentially higher levels.
Projection & Scenario Analysis
Bullish Scenario:
If FTM breaks above R1 ($1.2218) with significant volume, the next likely target is the diagonal resistance (R2), around the $1.50–$1.60 range.
Beyond this, continuation toward the previous highs at $2.00 is plausible.
Bearish Scenario:
A breakdown below S1 ($0.5220) would expose the price to a retest of S2 ($0.2537).
Failure to hold S2 would confirm a bearish trend reversal, opening the door for a prolonged downtrend.
Conclusion
In my analysis, the market for FTM/USDT remains in a critical decision-making phase. While the technical indicators suggest weakening bearish momentum, confirmation of a bullish reversal will only come with a decisive break above R1 at $1.2218. For now, I remain cautiously optimistic, with a watchful eye on the key support at $0.5220 to guide my next moves.
This is a time for patience, as a breakout from this consolidation zone will provide the clearest signal for the next major trend. Until then, both scenarios remain equally possible.
