3E2 trade ideas

ETSY- you got my attentionLooks like a nice breakout after 2 month trading in a range.
Another company that is benefitting from our new reality.


$ETSY (DAILY) - Cup Breakout$ETSY (DAILY)
Cup Breakout as on 10th Aug 2020 till 7th Oct 2020
100 day horizontal channel high broken out on 8th Oct 2020 , however red candle , await next candle for confirmation
RSI > 65
9 day EMA > 21 day EMA > 50 day MA
Volume is average
Buy above high of 144
Target Height of cup for $39 dollar move
OR
Target 2*ATR @ $13 move


$ETSY respecting PEAD Cone $ETSY respecting the PEAD Cone trading in Drift D above the mean as the EPS Momentum has predicted as it continues to push higher with a strong Earning Momentum

ESTY Title DailyHey traders, ESTY is in a very interesting moment in its history, we can make a new hitoric high. It is in a bullish movement with a low purchase volume executed and a hammer candle is formed. On TIMEFRAME 1Min we can see a bull hammer candle that wants to take off from the VWAP. Strong possibility of joining the last precedent higher, which corresponds to half of the median.
See the 4H which and also the 15 Min level, we can try to exceed it to find new resistances.
Please LIKE & FOLLOW, thank you!


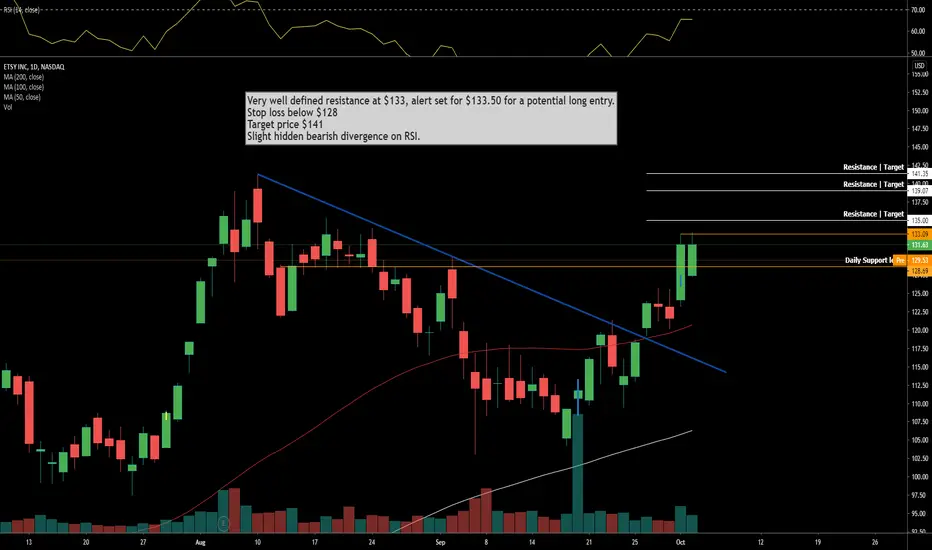
$ETSY On Breakout Alert
Very well defined resistance at $133, alert set for $133.50 for a potential long entry.
Stop loss below $128
Target price $141
Slight hidden bearish divergence on RSI.
$ETSY Reaching directional climax - Close watchWill this continue to rise into ER or fall before rising again into ER. Close watch!

ETSY - breaks out of the consolidation channelNASDAQ:ETSY left the consolidation channel upwards, aiming the former high at 139,5 $, above there would be a pro cyclical buy signal.
ADX is rising, +DI is positive
RSI is overbought, so the resistance will probably not be crossed at the first attempt


$ETSY At resistance short term bearish $ETSY At resistance short term bearish then uptrend into ER - Ideas welcomed.

$ETSY At resistance short term bearish $ETSY At resistance short term bearish bounce off support bullish into ER - Ideas welcomed.

$ETSY - playing retail e-commerce$ETSY is an e-commerce website for handmade goods.
I'd say in a soundbite that $$FB is $PINS what $AMZN is to $ETSY.
The stock was breaking out in August, and retraced to a strong support at 100-105 during the September selloff in a bear flag .
The stock has resumed its march upwards and was up 8% in a very good day for Internet retail stocks.
$130-135-140 are all resistances, but momentum is strong with this one.


ETSY LONG A strong company with good revenue streams and this is a company primed for growth. It broke the downtrend line but to enter would still like some stronger volume towards the close.
*NOT INVESTEMENT ADVICE*

ETSY Round UpETSY is showing a rounding formation upward to the 130-133 area. It has its moving averages converging nicely which will act as support. A break below the moving averages or outside of the rounding pattern would mean an exit will need to be taken.


$ETSY Possible Long entry above $120
Alert set for Break above the 50ma, with the
local downtrend as resistance..
Volume on Friday was poor despite the 4% gain.
Take note of volume resistance gap on the Fixed range.
Indicators are in Bullish uptrends.
A Break above $120 could see a nice rally to $128


