$ABNB Head and Shoulders Bottom$ABNB potential head and shoulders bottom @TechCharts
That said, supply around $135 is humongous.
Just watching how this unfolds for signals whether growth stocks potentially bottomed at these levels.
6Z1 trade ideas

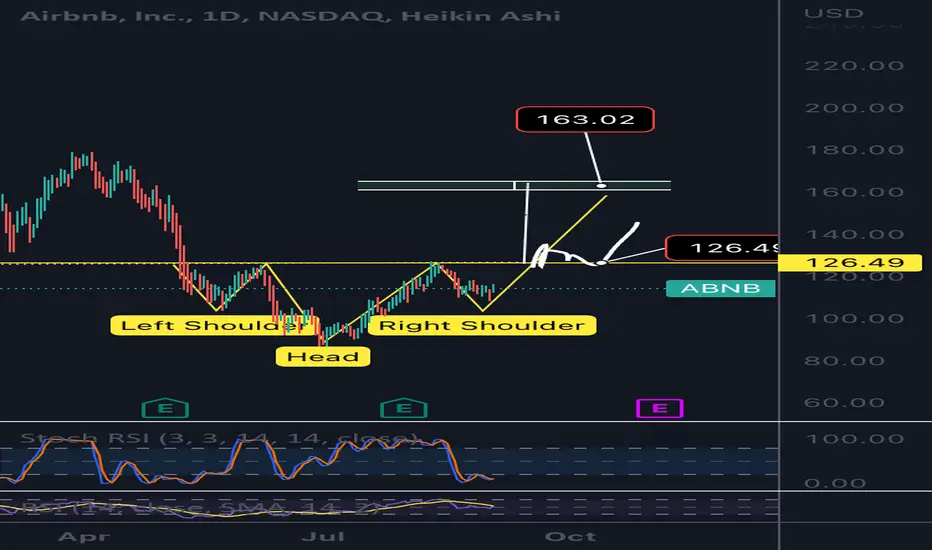
Abnb Could be forming an inverses head and shoulders. Per technical analysis and proper positioning we don’t want to speculate long and just hop in a postion. You can of course try this with proper risk managmebt upon the right shoulder being formed as it looks to be, Howver from a risk to reward level we should wait for some candle closes. Preferably a daily candle body flat or mulple closes above 127$. This could target us up towards 160s for the targeted move. If this plays out would be an excellent position with proper stoploss upon entry.
ABNB ShortCramer says it's a buy!
Rising Wedgeish, if this breaks down. It'll hit 105. Maybe 100 to fill that gap.

ABNB hot air? Airbnb
Short Term
We look to Sell at 118.71 (stop at 125.98)
Preferred trade is to sell into rallies. Selling continued from the 78.6% pullback level of 117.21. The medium term bias remains bearish. Trading has been mixed and volatile.
Our profit targets will be 102.40 and 100.10
Resistance: 119.00 / 124.00 / 136.50
Support: 100.00 / 91.01 / 87.00
Disclaimer – Saxo Bank Group. Please be reminded – you alone are responsible for your trading – both gains and losses. There is a very high degree of risk involved in trading. The technical analysis, like any and all indicators, strategies, columns, articles and other features accessible on/though this site (including those from Signal Centre) are for informational purposes only and should not be construed as investment advice by you. Such technical analysis are believed to be obtained from sources believed to be reliable, but not warrant their respective completeness or accuracy, or warrant any results from the use of the information. Your use of the technical analysis, as would also your use of any and all mentioned indicators, strategies, columns, articles and all other features, is entirely at your own risk and it is your sole responsibility to evaluate the accuracy, completeness and usefulness (including suitability) of the information. You should assess the risk of any trade with your financial adviser and make your own independent decision(s) regarding any tradable products which may be the subject matter of the technical analysis or any of the said indicators, strategies, columns, articles and all other features.
Please also be reminded that if despite the above, any of the said technical analysis (or any of the said indicators, strategies, columns, articles and other features accessible on/through this site) is found to be advisory or a recommendation; and not merely informational in nature, the same is in any event provided with the intention of being for general circulation and availability only. As such it is not intended to and does not form part of any offer or recommendation directed at you specifically, or have any regard to the investment objectives, financial situation or needs of yourself or any other specific person. Before committing to a trade or investment therefore, please seek advice from a financial or other professional adviser regarding the suitability of the product for you and (where available) read the relevant product offer/description documents, including the risk disclosures. If you do not wish to seek such financial advice, please still exercise your mind and consider carefully whether the product is suitable for you because you alone remain responsible for your trading – both gains and losses.

$abnbHave to revise my immediately bearish view on airbnb with leading diagonal count ..so a PB and more up ,, big trend line resistance 146 ...not shown on this image

Bear flag complete followed by bearish pennantThe chart speaks for itself. This is back to back bearish patterns forming.

ABNB Short Term Breakout?After ER crush, ABNB rebounded to pre-ER price within 2 trading sessions. In my prior post, I notified a triangle consolidation that led to a big breakout. My bearish macro bias led me to believe the consolidation would lead to a breakdown. I was wrong.
There are monkeypox outbreak FUD shuffled with various negative macroeconomic news making rounds in the media. Without paying attention to the news cycle and judging by this chart alone, it appears a breakout is forming (in sympathy with EXPE's equally great ER). I do not see any resistance to $125-ish. I currently hold shares only and may try to catch some % of the upside tomorrow 8/5/2022 with calls. My outlook is bullish very short-term.

AIRBNB - BULLISH SCENARIO AIRBNB reported on Tuesday the earnings report. The results were more than satisfactory.
The EPS forecast was beaten by more than 25%. The forecast was for 0.4467 and the actual 0.56
Also, ABNB announced a 2 billion stock buyback
From a technical perspective, the price is at the major resistance level. The price is expected to get back into the price channel with 1st resistance located at 0.618 Fibonacci or $133-$134
Risk Disclosure: Trading Foreign Exchange (Forex) and Contracts of Difference (CFD's) carries a high level of risk. By registering and signing up, any client affirms their understanding of their own personal accountability for all transactions performed within their account and recognizes the risks associated with trading on such markets and on such sites. Furthermore, one understands that the company carries zero influence over transactions, markets, and trading signals, therefore, cannot be held liable nor guarantee any profits or losses.

Ive been watching thisI didnt have the guts to pull the trigger on this yet ahead of ER. Now that AAPL and AMZN are out of the way its something I want to try and lotto before ER. I think this should have a pretty sizable move from here. Er's are a coin flip but the way the market has been treating bad ER's seems like expectations are so low that things are priced in, at least for now. Tomorrow may be good for a Friday scalp. Bulls will want to push this above last week's high and close above it. Market can get extended on this next push so use caution. But if you can scalp the move tomorrow, if/when it happens, then you will be able to pay for next week's calls as a lotto. At least, that's what I am going to try and do. Its risky for sure because the sector ABNB is in more exposed to inflation, wars, COVID but I think if you execute correctly it could be a nice trade setup.

ABNB Long -- short term long -- expecting pull back later Current chart target uptrend towards $125 -- expecting a pull back for consolidation. A lot of pressure at $131-133 area. Could take a long time to accumulate force to break through $133.

Follow upTraded the intraday cup and handle, hit 1.618 target. ER is on 08/02 so if you are following you have a great entry to swing if you want

ABNB reversing?I like the company overall.
And it just hit an all time low. I already own a lot of shares, so i am interested in averaging my position.
I have 2 different strategies or entries.
1- Above 98
2- At 87.60 (lows)
Ideally we should wait for a break of the trendline.
But it is looking like we just made a new lower high, so it could be reversing already

ABNB - Inverted H&S recovery Left Shoulder of this Inverse H&S has formed along middle downtrend
The Head has formed along the bottom downtrend
The right shoulder is yet to form, but I have plotted what the potential movement will look like with a double curve


ABNB bounce coming?Airbnb could bounce here, in time for the Q (one of their first profitable quarter).

ABNB death crossABNB death cross on the 30 mins chart. 103 is ATL, once it breaks it there is no bottom nor support. On the flow side, I see a lot of sell 125c 7/15. I need to validate it on Monday. So far flow is bearish


Abnb We finally lost support of this wedge. If we pop back to 123.77 this may be a great place for a short upon rejection. We have to see a rejection of this level for it to confirm it’s breaking and flipping to reistance. With a downside target of 115 if this plays out. Any pushes above 124.80 and holds cpuld invalidate this as that’s the rising wedge upper reistance

Abnb Although making bullish moves up reclaiming previous reistance a as new support we are still in this rising wedge. I keep expecting it to lose support of it but it just keeps
Holding within it. We can contiue making higher highs and higher lows as long as we stay in here. I’d still keep in mind as long as we don’t lose 121.30 area this can contiue to climb in here

Abnb Is abnb finally breaking this uptrend support here? If we can’t see price reclaim 122 this may give the next signal move for abnb. With the large wick this morning although bought up pretty clearly we got ANoThEr clear rejection on that 123.80 level. If we do get this breakdown and just hang sideways we may have to reevaluate this pattern.

AbnbStill respecting this rising wedge with potential of inverse head and shoulders. For me holding 122$ as new support could setup as a bullish look but we do need to carefully watch this rising wedge as if we break and confirm as resiatnce this could drop fast. Howver hplding 122 and ultimately holding 123 would be a huge huge bullish look potentially. I am not certain this wedge won’t breakdown so trade cautiously

Abnb Uptrend support has held. We are flipping green on the hourly. On 4 hour we have ichumchi cloud converging blue and red line. Bull line was reistance and we rejected off it multiple times on the downtrend. Currently the 4 hour recent drop tapped it perfectly to a T and we are slowly rolling up. Daily is showing an inverse head and shoulders 123) neckline. While a rising wedge is in veiw we haven’t broken it and are holding this support. Which would mean if we can clear and confirm 123 as support this can get bullish AF at least to 131$ area

Abnb So this rising wedge we have been tracking did find so far a wick on hourly perfectly to the support around 117.75. If we can contiue to hold we could see another push up towards 123 reistance. If we pop that area then the rising wedge next peak rising resitance is around 123.80. We could do puts around that peak area but if we flip 123 as support and go sideways that may allow for a new pattern to form. But usually these rising wedges breakdown Howver I can also see a large inverse head and shoulders as well. So to me this all relys on this neckline of 123$ as a HUgE area
