Daily Price Action: GBPJPY Wednesday 4/23/2025In this video, we will be looking into the potential price action of GBPJPY.
GBPJPY.100.CSM trade ideas

GBPJPY BUYWe can see price breaking and closing above our bullish triangle. We expect price to push further to the up side

Two different methods Looking at the chart it broke through first one retraced backed from it’s resistance point made retested made another triangle Broke again moved upward retested resistance the lows are also getting higher too much retesting the resistance may be it got weeker we can look for a buy

GBPJPY Potential DownsidesHey Traders, in today's trading session we are monitoring GBPJPY for a selling opportunity around 189.100 zone, GBPJPY is trading in a downtrend and currently is in a correction phase in which it is approaching the trend at 189.100 support and resistance area.
Trade safe, Joe.

GBPJPY short bearish push expecting
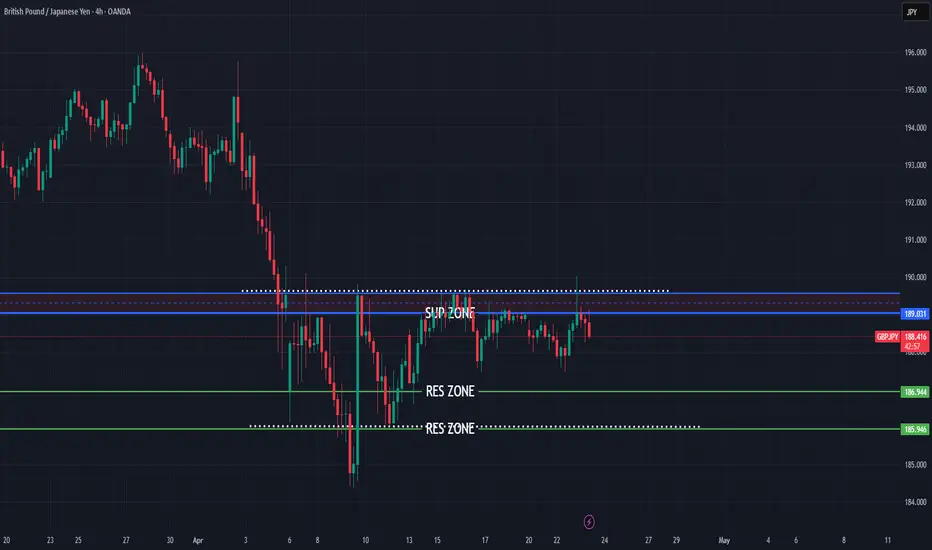
OANDA:GBPJPY price action based trade, here short bearish push expecting till bottom line.
SUP zone: 189.050
RES zone: 186.950, 185.950

Trading balanceTrading balance The price of the asset has rebounded from the balance zone. With the prospect of growth into the resistance zone.
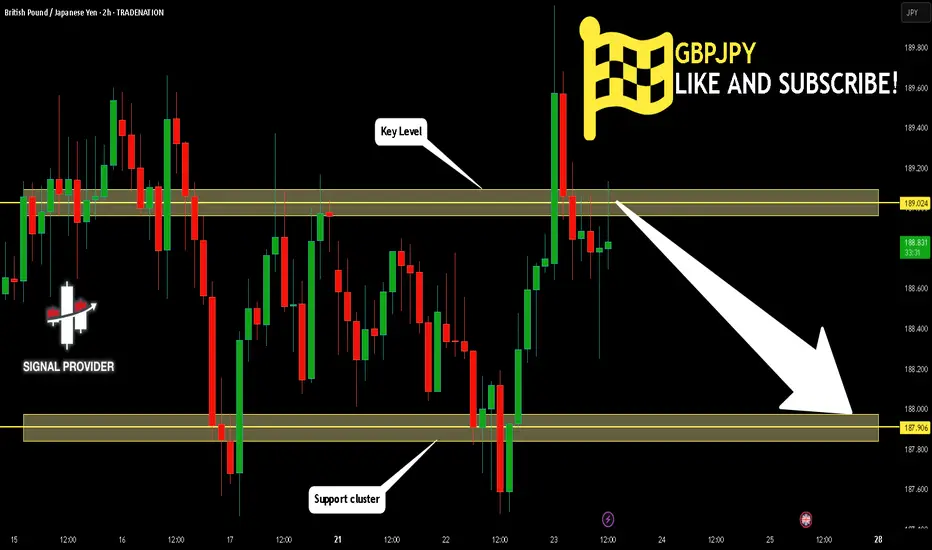
GBPJPY Will Fall! Short!
Please, check our technical outlook for GBPJPY.
Time Frame: 2h
Current Trend: Bearish
Sentiment: Overbought (based on 7-period RSI)
Forecast: Bearish
The market is approaching a key horizontal level 189.024.
Considering the today's price action, probabilities will be high to see a movement to 187.906.
P.S
We determine oversold/overbought condition with RSI indicator.
When it drops below 30 - the market is considered to be oversold.
When it bounces above 70 - the market is considered to be overbought.
Disclosure: I am part of Trade Nation's Influencer program and receive a monthly fee for using their TradingView charts in my analysis.
Like and subscribe and comment my ideas if you enjoy them!
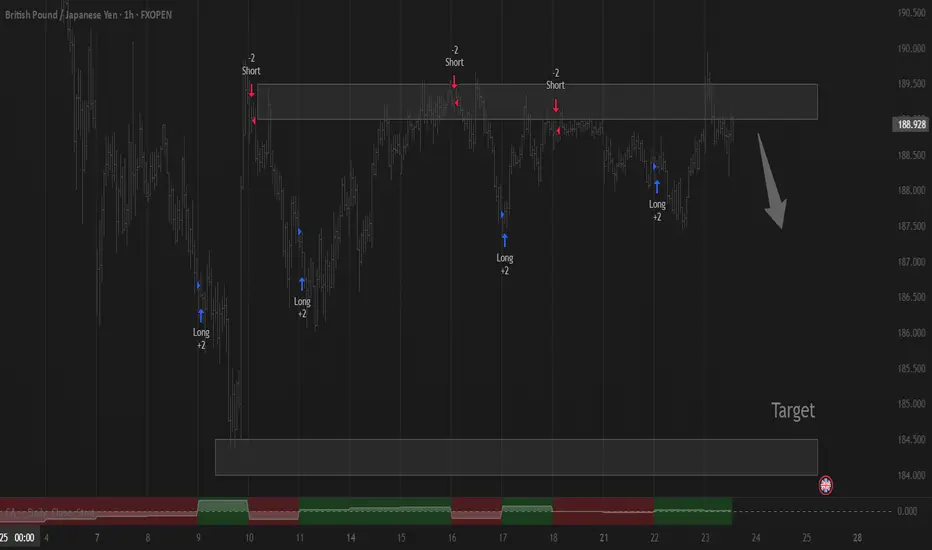
[_] ONENTRY### **GBP/JPY - ‘2FIB Strategy’ by ONENTRY**
**Timeframe:** 30 Minutes
**Session:** London & New York
### **Step 1: Identify the Overnight Range**
- Mark the **high** and **low** of the price range between **00:00 - 06:30 (+2GMT)**.
- Wait for a **clear breakout** with a candle *closing* above (for longs) or below (for shorts) this range.
### **Step 2: Apply Fibonacci Levels**
- After the breakout, use the **Fibonacci retracement tool**:
- **Anchor Point 1:** Start at the *close* of the breakout candle body.
- **Anchor Point 2:** Drag to the *start* of the impulse move - first candle body of the range.
- Key level for entry: **0.5 and** **0.35 retracement**.
### **Step 3: Trade Execution**
- **Entry:** Enter on a pullback to **0.5** and **0.35 Fib level** after the breakout.
- **Stop Loss :**
- *Long trades:* Below the **low of the breakout candle’s body**
- *Short trades:* Above the **high of the breakout candle’s body**.
- **Take Profit Targets:**
- **TP1:** 1.0 Fib
- **TP2:** 1.25 Fib extension.
- TP3: 1.6 FIB extension
- **TP4:** 2.3 Fib extension (runner position).
### **Step 4: Trade Management**
- Move SL to breakeven when price hits **TP1**.
- Close the running trade before midnight.
Always Test The Strategyevels**
- After the breakout, use the **Fibonacci retracement tool**:
- **Anchor Point 1:** Start at the *close* of the last impulse candle wick.
- **Anchor Point 2:** Drag to the *start* of the impulse move - first candle wick of the range.
- Key level for entry: **0.5 and** **0.35 retracement**.
### **Step 3: Trade Execution**
- **Entry:** Enter on a pullback to **0.5** and **0.35 Fib level** after the breakout.
- **Stop Loss :**
- *Long trades:* Below the **low of the breakout candle wick.**
- *Short trades:* Above the **high of the breakout candle wick.**
- **Take Profit Targets:**
- **TP1:** 1.0 Fib
- **TP2:** 1.25 Fib extension.
- TP3: 1.6 FIB extension
- **TP4:** 2.3 Fib extension (runner position).
### **Step 4: Trade Management**
- Move SL to breakeven when price hits **TP1**.
- Close the running trade before midnight.
Always Test The Strategy

downtrendThe triangle pattern is expected to complete at the current range and then we will see the start of the downtrend.

GBP/JPY SELLERS WILL DOMINATE THE MARKET|SHORT
Hello, Friends!
GBP/JPY uptrend evident from the last 1W green candle makes short trades more risky, but the current set-up targeting 186.077 area still presents a good opportunity for us to sell the pair because the resistance line is nearby and the BB upper band is close which indicates the overbought state of the GBP/JPY pair.
Disclosure: I am part of Trade Nation's Influencer program and receive a monthly fee for using their TradingView charts in my analysis.
✅LIKE AND COMMENT MY IDEAS✅

GBPJPY IS A BUY (Britsh Pound-CPI News)TP: 190.00+
SL: 187.00
There is support forming for GBPJPY, which we could be looking for a buying opportunity. We have CPI news for the British Pound Dollar that could make this possible on Wednesday.

GJ-Wed-23/04/25 TDA-Will we have daily close above 189.600 soon?Analysis done directly on the chart
I need some constructive feedback!
If you've been following my analysis for some time,
how are you finding my analysis? Is it bad or is it good?
Do you have any suggestions to improve?
Comment down below!
Not financial advice, DYOR.
Market Flow Strategy
Mister Y

GBPJPYGBPJPY
- Completed " 12345 " Impulsive Waves
- Break of Structure
- Consolidation Phase
- Demand Zone
* Fibonacci Level - 50.00% / 61.80%

EVERYONE SELL NOW GBPJPY!!!!!!!GBPJPY took out the sell side liquidity with a retest to the supply zone am looking forward to see price create new lows 187.500 is my main target
JOIN AND ENJOY
Lets know your thoughts on this..........

GBP Potential buy (Keep it simple)So I'm seeing a potential shift for buys. Price is having a hard time breaking a resistance area. With liquidity, this gives the big money a sling shot before taking off with an impulsive move.
Don't get greedy! Make sure you perfect your entries with a simple method...Supply & Demand, but stay patient with price breaking structure on smaller time frames to give you a great entry.
Happy Trading!!

Trendline breakThe price has broken a bullish trendline followed by a pullback as a trendline on the 1 hour timeframe, followed by a breakout, now we have a small pullback and if the price makes a lower low we are going short
WE ONLY TRADE PULLBACKS

New Pair under my belt, GBPJPY! Let's see how this goes.. I have been closely monitoring GBP/JPY, currently trading around 188.775. The pair has been hovering near resistance, and multiple technical indicators suggest momentum is weakening. My focus is on institutional absorption near 188.75–189.00, where price has struggled to break higher.
Examining price action, I see rejection wicks forming near resistance, confirming potential sell-side control. MACD divergence on the hourly timeframe indicates slowing momentum, and RSI is hovering around 54.69, reflecting a neutral stance rather than strong bullish continuation. ADX at 18.83 suggests the trend is weak, meaning price could be consolidating before a directional move.
Support sits near 187.50–188.00, where price has previously shown demand. If institutions absorb sell orders here, a long position toward 189.00 may develop. However, if price fails to hold above 188.75, a short trade targeting 187.50 aligns with institutional rejection patterns. With volume showing signs of clustering near resistance, the probability of a pullback is increasing.
At this point, I am watching how price reacts near key liquidity zones. If sellers continue defending 188.75, I will wait for bearish confirmation before executing a short trade. Alternatively, if price holds above 188.50 with bullish volume, I will reassess my bias for a potential breakout toward 189.50. Managing risk effectively and waiting for clear signals will be the key to executing the best trade setup.

LOOKING TO TAKE THIS MARKET LONGGBP/JPY 1H - I am looking to take this market long as well, I am expecting weakness in the dollar this week and this market backs my thoughts based on the fundamentals.
We have seen that price has come to trade back into this area of Demand and in doing so has provided us with the potential means to get involved with some long trades.
In order for me to take part in this market long though I want to get involved with a refined entry, I have gone ahead and set an alert just above zone price has traded into recently and one above the zone lower.
I want to see price either correct itself fractally now, trading down to clear the FVG or lower down and into the large Demand Zone I have marked out for us. I will update you all when I have something.

GBPJPY is coming out of consolidation... With the decline of the dollar, the Japanese yen is gaining momentum and strengthening.
GBPJPY currency pair is under pressure from sellers.
The price is coming out of the triangle down, the continuation of the main downward movement is possible when the support at 188.23 is broken.
Scenario: Consolidation below the triangle support and subsequent break of 188.234 support may attract new sellers, which may cause a fall to 187.46 - 186.59.

Why I Think GBPJPY May Continue to Sell...Technical AnalysisHey Rich Friends,
I think GBPJPY will continue to sell today and maybe this week. This is only a technical analysis so check the news and cross-reference your charts/indicators. Here is what I am looking at:
- The market has already rejected the daily high of 188.852, which is a strong sign that it can continue to move down.
- The 4-hour low was broken, and sellers are picking up momentum on lower time frames.
- The stochastic is facing down, the slow line (orange) is above the fast line (blue), and both lines have crossed below 50
Sell stops are recommended. I will use previous lows as TPs and previous highs as stop losses. Good luck if you decide to take this trade. Let me know how it goes in the comments.
Peace and Profits,
Cha

Short GBP/JPYThe price broke out of triangle retested the previous trendline and then entered a bearish trend on 1H so I expect price to go to previous strong support. SL is just above the point where trendline was broken.
SL 188.8
entry 187.85
TP184.5

GJ-Tue-22/04/25 TDA-Money flowing into Gold, Yen not much!Analysis done directly on the chart
GJ not breaking out, stucking inside this wide range.
It's hard to have good setups, if you are not already
in the trade. Best and safest way to deal with GJ is
just let the market range until clear structure is made.
Not financial advice, DYOR.
Market Flow Strategy
Mister Y
