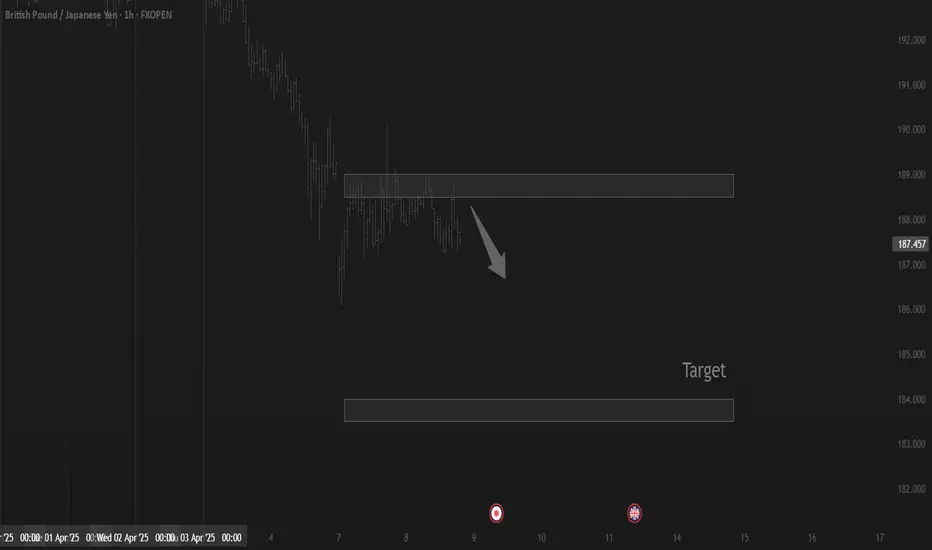
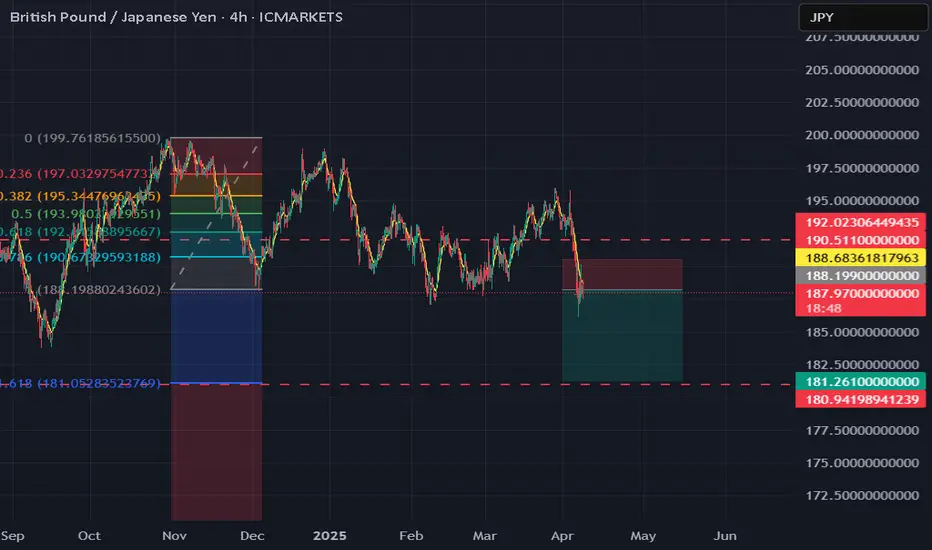
GBP/JPY risky long on 4Hwe have approached bottom of the bearish channel and saw rejection from there. I expect price to form double bottom like it diid before so I have opened short position with TP 186.7 then I expect bullish behaviour until 193 to repeat history
GBPJPY.100.CSM trade ideas

Elliott Wave Indicates Bearish Sequence for GBPJPYThe Elliott Wave perspective indicates that GBPJPY has entered a bearish sequence from its October 30, 2024 high. It signals further downside potential. From that peak, wave (W) concluded at 187.05, followed by a wave (X) rally that terminated at 195.94, as illustrated in the accompanying 1-hour chart. Currently, wave (Y) is unfolding lower, exhibiting an internal zigzag structure.
Breaking it down from the wave (X) high, wave ((i)) declined to 192.7. The subsequent wave ((ii)) rally peaked at 195.77. The pair then resumed its descent in wave ((iii)), reaching 187.51, before a wave ((iv)) bounce concluded at 190.29. The final leg, wave ((v)), completed at 186.05, marking the end of wave A in a higher degree. From there, wave B unfolded as a zigzag corrective pattern: wave ((a)) rose to 188.83, and wave ((b)) pulled back to 187.09. Wave ((c)) advanced to 190.08, completing wave B. The pair has since resumed its decline in wave C.
In the near term, as long as the pivotal high at 195.94 remains intact, any rallies are expected to falter in a 3, 7, or 11 swing structure, reinforcing the outlook for further downside. Traders monitoring this setup should anticipate limited upside and watch for confirmation of this bearish continuation.

GBPJPY TRADE UPDATE: 1:1 PROFIT ACHIEVED With our 1:1 profit target achieved, we'll now aim for a 1:2 ratio. To lock in some gains, let's secure half of the profits and allow the remaining position to run towards the full take-profit level.

Buy Limit GBPJPYBuy Limit orders for GBPJPY at 186,308. We will be targeting 187,888. We can have stop losses at 185,999. Let us see how it goes

GBPJPYYEN will continue to appreciate against others pairs especially the British pounds sterling.the bank of japan monetary polices is playing out big

GBP/JPY Daily AnalysisPrice is testing support for the 3rd time (last tested and rejected in late 2024 and February 2025)
This MAY now lead to opportunities to buy if we see a bullish setup or bullish impulse and correction.
A break and close below support would invalidate this idea.
This is just an idea of what could happen. You should always trade with a well tested and profitable trading strategy using good risk management.

[_] ONENTRY This will be second attempt if the first one hits SL
ONENTRY
GBP/JPY - ONENTRY ' 2Fib Strategy '
Timeframe: 30 Minutes
Session: London Pre-Market (00:00 - 06:30 +2GMT)
Step 1: Identify the Overnight Range
Mark the high and low of the price range between 00:00 - 06:30 (+2GMT).
Wait for a clear breakout with a candle closing above (for longs) or below (for shorts) this range.
Step 2: Apply Fibonacci Levels
After the breakout, use the Fibonacci retracement tool:
Anchor Point 1: Start at the close of the breakout candle.
Anchor Point 2: Drag to the start of the impulse move (first candle of the range).
Key level for entry: 0.5 and 0.35 retracement.
Step 3: Trade Execution
Entry: Enter on a pullback to 0.5 and 0.35 Fib level after the breakout.
Stop Loss :
Long trades: Below the low of the breakout candle’s body.
Short trades: Above the high of the breakout candle’s body.
Take Profit Targets:
TP1: 1.0 Fib (1:1 risk-reward).
TP2: 1.25 Fib extension.
TP3: 1.6 FIB extension
TP4: 2.3 Fib extension (runner position).
Step 4: Trade Management
Move SL to breakeven when price hits TP1.

GBPJPYCurrently, GBP/JPY is in a bearish trend, forming lower highs and lower lows, while taking support at a major support level.
If the pair reverses from this level without breaking the previous low of 186.22, and then gives a breakout above 189.756, we will consider taking a long position.
Our stop-loss will be placed at 185.794, with targets set at 192.824 and 194.824.

TRADING PLAN: GBPJPY SHORT TRADE SETUP Considering the bearish sentiment in GJ today, and the successful liquidity grab at the Asian session high, we'll take a short position. Our initial target is a 1:1 risk-reward ratio, followed by a 1:2 ratio after securing some profits.

[_] ONENTRYONENTRY
First attempt !
GBP/JPY - ONENTRY ' 2Fib Strategy '
Timeframe: 30 Minutes
Session: London Pre-Market (00:00 - 06:30 +2GMT)
Step 1: Identify the Overnight Range
Mark the high and low of the price range between 00:00 - 06:30 (+2GMT).
Wait for a clear breakout with a candle closing above (for longs) or below (for shorts) this range.
Step 2: Apply Fibonacci Levels
After the breakout, use the Fibonacci retracement tool:
Anchor Point 1: Start at the close of the breakout candle.
Anchor Point 2: Drag to the start of the impulse move (first candle of the range).
Key level for entry: 0.5 and 0.35 retracement.
Step 3: Trade Execution
Entry: Enter on a pullback to 0.5 and 0.35 Fib level after the breakout.
Stop Loss :
Long trades: Below the low of the breakout candle’s body.
Short trades: Above the high of the breakout candle’s body.
Take Profit Targets:
TP1: 1.0 Fib (1:1 risk-reward).
TP2: 1.25 Fib extension.
TP3: 1.6 FIB extension
TP4: 2.3 Fib extension (runner position).
Step 4: Trade Management
Move SL to breakeven when price hits TP1.

Trading balanceTrading balance The price of the asset has rebounded from the balance zone. With the prospect of growth into the resistance zone.
[_] ONENTRYONENTRY
GBP/JPY - ONENTRY ' 2Fib Strategy '
Timeframe: 30 Minutes
Session: London Pre-Market (00:00 - 06:30 +2GMT)
Step 1: Identify the Overnight Range
Mark the high and low of the price range between 00:00 - 06:30 (+2GMT).
Wait for a clear breakout with a candle closing above (for longs) or below (for shorts) this range.
Step 2: Apply Fibonacci Levels
After the breakout, use the Fibonacci retracement tool:
Anchor Point 1: Start at the close of the breakout candle.
Anchor Point 2: Drag to the start of the impulse move (first candle of the range).
Key level for entry: 0.5 and 0.35 retracement.
Step 3: Trade Execution
Entry: Enter on a pullback to 0.5 and 0.35 Fib level after the breakout.
Stop Loss :
Long trades: Below the low of the breakout candle’s body.
Short trades: Above the high of the breakout candle’s body.
Take Profit Targets:
TP1: 1.0 Fib (1:1 risk-reward).
TP2: 1.25 Fib extension.
TP3: 1.6 FIB extension
TP4: 2.3 Fib extension (runner position).
Step 4: Trade Management
Move SL to breakeven when price hits TP1.

GJ retesting POCLooking to short GJ to POC based on Elliot wave and H4 momentum shift.
Trade safe and good luck
GBPJPY - BuyJust entered a long on GBPJPY after a clean sweep of the Asian session low. Price dipped into a key area of interest, rejecting from the 61.8% retracement, signaling a potential reversal. With liquidity grabbed and bullish momentum kicking in, I’m looking for a push back toward the highs.
Let’s see if this plays out! Managing risk and riding the move.
TRADE:
Entry: 188.011
Stop: 187.720
Profit: 188.589

GBPJPY SELL OPPORTUNITYGBPJPY SELL OPPORTUNITY
GBPJPY QML formed, and the price began
to fall. The upward trendline has been
broken down.
Therefore, try to continue to sell GBPJPY when
the price pull back around 188.3-188.5
Entry:around 188.3-188.5
SL:above 189.05
TP#1:186.5
TP#2:184.7

GBPJPY SELL NOW!!!!!!!!!GBPJPY completed +45pips from yesterdays analysis today we have price making strong rejections off the equal highs and also formed a rising wedge breakouts am in on a sell from this point holding to see price create new lows 184.000 is my goal target

GJ-Tue-8/04/25 Top down analysis-HTF structure form to 184.600?Analysis done directly on the chart
No matter how good you are, there's always room for
improvement. Everyone should be students forever.
We need to adapt ourself to changes. Life is dynamic,
be open minded, be curious. Don't fix your mind in just
one way, think differently.
Not financial advice, DYOR.
Market Flow Strategy
Mister Y

GBPJPY H4 | Bearish Drop Based on the H4 chart, the price is rising toward our sell entry level at 191.02, a pullback resistance that aligns with the 50% Fibo retracement.
Our take profit is set at 187.32, a multi-swing low support.
The stop loss is set at 193.72, a pullback resistance that aligns with the 78.6% Fibo retracement.
High Risk Investment Warning
Trading Forex/CFDs on margin carries a high level of risk and may not be suitable for all investors. Leverage can work against you.
Stratos Markets Limited (fxcm.com/uk):
CFDs are complex instruments and come with a high risk of losing money rapidly due to leverage. 63% of retail investor accounts lose money when trading CFDs with this provider. You should consider whether you understand how CFDs work and whether you can afford to take the high risk of losing your money.
Stratos Europe Ltd (fxcm.com/eu):
CFDs are complex instruments and come with a high risk of losing money rapidly due to leverage. 63% of retail investor accounts lose money when trading CFDs with this provider. You should consider whether you understand how CFDs work and whether you can afford to take the high risk of losing your money.
Stratos Trading Pty. Limited (fxcm.com/au):
Trading FX/CFDs carries significant risks. FXCM AU (AFSL 309763), please read the Financial Services Guide, Product Disclosure Statement, Target Market Determination and Terms of Business at fxcm.com/au
Stratos Global LLC (fxcm.com/markets):
Losses can exceed deposits.
Please be advised that the information presented on TradingView is provided to FXCM (‘Company’, ‘we’) by a third-party provider (‘TFA Global Pte Ltd’). Please be reminded that you are solely responsible for the trading decisions on your account. There is a very high degree of risk involved in trading. Any information and/or content is intended entirely for research, educational and informational purposes only and does not constitute investment or consultation advice or investment strategy. The information is not tailored to the investment needs of any specific person and therefore does not involve a consideration of any of the investment objectives, financial situation or needs of any viewer that may receive it. Kindly also note that past performance is not a reliable indicator of future results. Actual results may differ materially from those anticipated in forward-looking or past performance statements. We assume no liability as to the accuracy or completeness of any of the information and/or content provided herein and the Company cannot be held responsible for any omission, mistake nor for any loss or damage including without limitation to any loss of profit which may arise from reliance on any information supplied by TFA Global Pte Ltd.
The speaker(s) is neither an employee, agent nor representative of FXCM and is therefore acting independently. The opinions given are their own, constitute general market commentary, and do not constitute the opinion or advice of FXCM or any form of personal or investment advice. FXCM neither endorses nor guarantees offerings of third-party speakers, nor is FXCM responsible for the content, veracity or opinions of third-party speakers, presenters or participants.


GBP/JPY: Yen Strength Pushes Price Toward Key SupportGBP/JPY has posted a decline of more than 3% over the last four trading sessions, with bearish momentum growing as the market increasingly favors the Japanese yen in the short term. Demand for the yen has risen sharply since last week, when Donald Trump announced a minimum 10% tariff on all imports into the United States. This was further reinforced today by new comments proposing additional 50% tariffs on China, following Beijing’s announcement of countermeasures against the U.S.
The yen is historically considered one of the safest currencies, and the recent surge in uncertainty has helped it hold strong against the British pound.
Wide Sideways Range
The pair remains within a broad long-term range, bounded by a ceiling near 198.676 and a floor around 186.932. Although recent selling has brought the pair close to the lower boundary, price action has not yet been strong enough to break this level, keeping the sideways channel as the dominant technical formation to watch for now.
MACD
The MACD indicator has started to show a shift in market momentum, with the histogram oscillating below the zero line. This reflects ongoing bearish pressure based on recent moving average behavior, and as long as this pattern persists, selling momentum in GBP/JPY may become increasingly relevant in the coming sessions.
RSI
The RSI also reflects a bearish tone, with the line currently holding below the 50 level. However, the indicator is gradually approaching the oversold zone near the 30 level, which is typically where selling pressure may begin to ease, potentially opening the door for short-term bullish corrections.
Key Levels:
192.493 – Key resistance: Located in the middle of the broader range and roughly aligned with the 200-period moving average. Persistent price action near this level may signal the beginning of a bullish bias in the short term.
190.144 – Tentative zone: This level may act as a potential area for short-term bullish corrections.
186.932 – Current support: Positioned at the bottom of the broader range. If price action breaks below this level, it could pave the way for a much more significant downtrend in the sessions ahead.
By Julian Pineda, CFA – Market Analyst

GBPJPYWe can attempt to buy GBPJPY from specified level as it make HL , also there is no bearish divergence occur indicate that it moves upward.
SL , TP mention in chart.

GBPJPY still bullish view
OANDA:GBPJPY in first analysis RES zone reached, what's next here is still bullish for expect. First analysis attached, currently price is in ASCENDING CHANNEL. Technicals are still bullish to see.
SUP zone: 192.500
RES zone: 195.900, 196.900

GBPJPY Long4H main structure is bearish, the 1H internal structure is bullish which could be the beginning of the 4H pullback.
3 possible entries depending on how aggressive the sellers will be on the 15M pullback or if price breaks above the current range and holds the forming a new support, that could be a possible entry.
