GJ-Mon-7/04/25 Top down analysis-Hedging into safe haven YENAnalysis done directly on the chart
A lot has been happening macro economically recently.
Stay informed, follow the global news.
Financial Juice is a great website, app to stay up to date.
It's really easy to get lost in the market, start educating
yourself.
Not financial advice, DYOR.
Market Flow Strategy
Mister Y
GBPJPY.100.CSM trade ideas

[_] ONENTRY
GBP/JPY - ‘2FIB Strategy’ by ONENTRY
Timeframe: 30 Minutes
Session: London & New York
Step 1: Identify the Overnight Range
Mark the high and low of the price range between 00:00 - 06:30 (+1GMT).
Wait for a clear breakout with a candle closing above (for longs) or below (for shorts) this range.
Step 2: Apply Fibonacci Levels
After the breakout, use the Fibonacci retracement tool:
Anchor Point 1: Start at the close of the breakout candle body.
Anchor Point 2: Drag to the start of the impulse move - first candle body of the range.
Key level for entry: 0.5 and 0.35 retracement.
Step 3: Trade Execution
Entry: Enter on a pullback to 0.5 and 0.35 Fib level after the breakout.
Stop Loss :
Long trades: Below the low of the breakout candle’s body
Short trades: Above the high of the breakout candle’s body.
Take Profit Targets:
TP1: 1.0 Fib
TP2: 1.25 Fib extension.
TP3: 1.6 FIB extension
TP4: 2.3 Fib extension (runner position).
Step 4: Trade Management
Move SL to breakeven when price hits TP1.
Close the running trade before midnight.
!!! Always Test The Strategy !!!

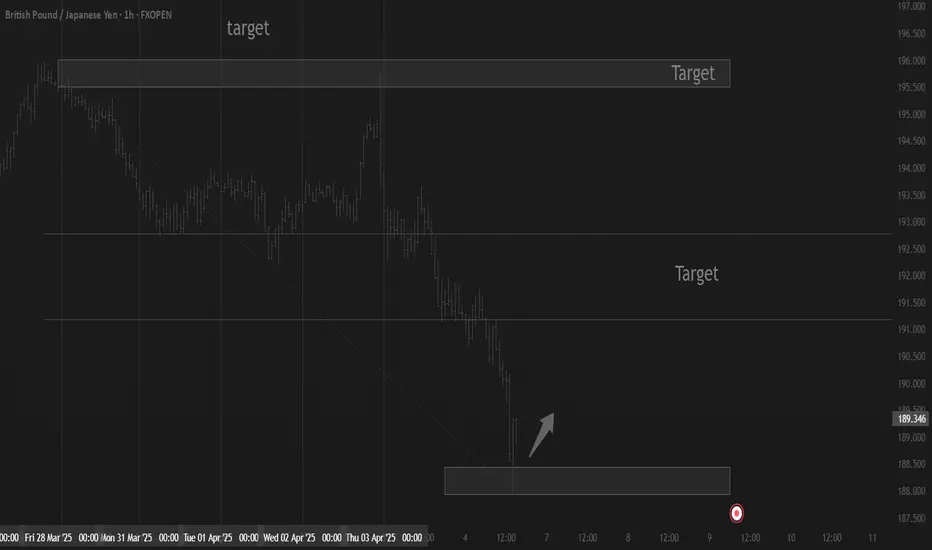
downtrendAs long as the price does not consolidate above the resistance trend line, the continuation of the downward trend is likely. In the future, the continuation of the downward trend is expected to form up to the specified support levels.

GBPJPYThe chart shows the expected movement of GBPJPY. First, I anticipate the price to push up to 195.423 , as indicated by the white line. This represents a bullish move before the market reverses. Once GBPJPY reaches this resistance level, I expect the price to drop back down to the support zone at **184.50**, marked by the blue line.
The **184.50** level is a key support area where the price may react. If it reaches this level, there is a possibility of a bounce or consolidation before the next move.

GBPJPY 1Hr Char my Analysis GBP/JPY is likely to reach 184.652 - 183.00, and it is possible that it may drop even further.

GBPJPY Selling opportunityNot much to see on GBPJPY as the price is currently reacting towards weekly demand zone.
We can expect for selling opportunity on the given selling zones.
Expect TP point on the low risk buying zone / support zone.

LONG ON GBP/JPYGJ has Taken a dive since last week.
The Jpy Index is now over brought and should begin falling.
This will cause most of the XXX/JPY pairs to rise.
EJ, NJ, and GJ all look great for a buying opp.
GJ has a morning star on the 15min TF, I am waiting for price to pullback to the FVG or demand area on the 15min TF before entering long.
This is a sell limit order risking 65 pips to make over 300 pips.
See you at the top.

GBPJPY TODAY FORECASTIn this forecast we're analyzing 2H time frame for GBPJPY. Today I'm looking for a potential buy trade setup. According to my analysis and strategy when price enters in my key levels as shown in the chart and give any bullish confirmation like candlestick pattern or price action. After taking confirmation we'll trigger our trade. Confirmation is most important part of this analysis.
Always use stoploss for your trade.
Always use proper money management and proper risk to reward ratio.
This is just my analysis. Further updates related this analysis will posted soon once price reach our levels.
#GBPJPY 2H Technical Analysis Expected Move.


GBPJPY Bullish Setup – 15-Minute Timeframe AnalysisA Market Structure Shift (MSS) has been identified on the 15-minute timeframe, signaling a potential bullish run for GBPJPY.
Before the bullish momentum unfolds, the market is expected to retrace and mitigate an Order Block (OB) below the current price. This move will likely induce retail traders to sell, creating liquidity for smart money to fuel the upside movement.
Once this liquidity grab is complete, I anticipate a strong move to the upside, targeting the 195.70 level, which aligns with key liquidity resting from last week’s bearish trend.
This setup presents a classic liquidity sweep and OB mitigation pattern often seen in smart money playbooks.

BUY GBPJPY Market OpenWe could see a quick rally on GBPJPY price during Asia session. Price is looking to retest a broken trend line around 192,2. Best place to enter would be 188,440.

GBPJPY Sells Will ContinueGBPJPY has entered a bearish phase. Price ended the week negative after consolidating on the resistance for a while. We see a breakout on the rising channel and expect price to touch 181,5 at least. However, we may have a retest towards 192,200 on Monday.

GBPJPY Downtrend ContinuationWhat do you guys anticipated on GBPJPY next week?
Are we going to see her to continue its downtrend?
If yes, where are you plan to join?
So, what's with my supply zone?
1. H4 H1 says the same, downtrend
2. Supply zone with imbalance
3. SBR also present, can be where the price going to reverse (it's not my entry zone, I don't mind of missing)
For this trading cycle, I will only targeted 1:2RR only and see how it goes.
Have a wonderful trading week guys, remember to follow your system, makes it consistent.

GBP/JPY "The Dragon" Forex Bank Bullish Heist Plan🌟Hi! Hola! Ola! Bonjour! Hallo! Marhaba!🌟
Dear Money Makers & Robbers, 🤑 💰💸✈️
Based on 🔥Thief Trading style technical and fundamental analysis🔥, here is our master plan to heist the GBP/JPY "The Dragon" Forex Bank. Please adhere to the strategy I've outlined in the chart, which emphasizes long entry. Our aim is the high-risk Red Zone. Risky level, overbought market, consolidation, trend reversal, trap at the level where traders and bearish robbers are stronger. 🏆💸Book Profits Be wealthy and safe trade.💪🏆🎉
Entry 📈 : "The vault is wide open! Swipe the Bullish loot at any price - the heist is on!
however I advise to Place buy limit orders within a 15 or 30 minute timeframe most recent or swing, low or high level. I Highly recommended you to put alert in your chart.
Stop Loss 🛑:
Thief SL placed at the recent / nearest low level Using the 4H timeframe (190.000) swing trade basis.
SL is based on your risk of the trade, lot size and how many multiple orders you have to take.
🏴☠️Target 🎯: 199.000 (or) Escape Before the Target
🧲Scalpers, take note 👀 : only scalp on the Long side. If you have a lot of money, you can go straight away; if not, you can join swing traders and carry out the robbery plan. Use trailing SL to safeguard your money 💰.
GBP/JPY "The Dragon" Forex Bank Heist Plan (Day Trade) is currently experiencing a bullishness,., driven by several key factors.
📰🗞️Get & Read the Fundamental analysis, Macro Economics, COT Report, Quantitative Analysis, Intermarket Analysis, Sentimental Outlook, Positioning and future trend...
Before start the heist plan read it.👉👉👉
📌Keep in mind that these factors can change rapidly, and it's essential to stay up-to-date with market developments and adjust your analysis accordingly.
⚠️Trading Alert : News Releases and Position Management 📰 🗞️ 🚫🚏
As a reminder, news releases can have a significant impact on market prices and volatility. To minimize potential losses and protect your running positions,
we recommend the following:
Avoid taking new trades during news releases
Use trailing stop-loss orders to protect your running positions and lock in profits
💖Supporting our robbery plan 💥Hit the Boost Button💥 will enable us to effortlessly make and steal money 💰💵. Boost the strength of our robbery team. Every day in this market make money with ease by using the Thief Trading Style.🏆💪🤝❤️🎉🚀
I'll see you soon with another heist plan, so stay tuned 🤑🐱👤🤗🤩

GBPJPY Will Fall! Short!
Take a look at our analysis for GBPJPY.
Time Frame: 1D
Current Trend: Bearish
Sentiment: Overbought (based on 7-period RSI)
Forecast: Bearish
The market is testing a major horizontal structure 189.486.
Taking into consideration the structure & trend analysis, I believe that the market will reach 183.143 level soon.
P.S
The term oversold refers to a condition where an asset has traded lower in price and has the potential for a price bounce.
Overbought refers to market scenarios where the instrument is traded considerably higher than its fair value. Overvaluation is caused by market sentiments when there is positive news.
Disclosure: I am part of Trade Nation's Influencer program and receive a monthly fee for using their TradingView charts in my analysis.
Like and subscribe and comment my ideas if you enjoy them!

GBPJPY next week bias Good day traders, hope we all made money following the resent market volatility but regardless we back again on the job.
GBPJPY on the daily TF we had a market structure shift lower falling in line with the weekly structure, going into the new week we’d like to see the market open higher and give up ICT’s power of 3 which basically means we wanna see price go against our bias(sells) Monday and Tuesday and maybe till morning Wednesday. On the TF shown here 4hour TF we can also see that price shifted lower now using the OTE that ICT explains in his 2022 model, we will only consider taking our sells once price starts rejecting the FIB levels above.

When Technicals meet Fundamentals power move occur Trump tariffs triggered shifts in intraday market direction with the blue trendline showing mss. Waiting to see retest to short.

GBPJPY Motive Wave to the DownsideThe ascending channel has been broken and we are in a motive wave to the downside.
In my primary count, we are currently in blue 4 correction, and further legs to the downside are expected for green III and V.

GBPJPY APRILIsland v Island, which will you choose?
We buying this son of a bullion. Ultra short on the YEN. Don't ask me why. Sell peaks, because you never go all in on an island.

POTENTIAL SHORT TRADE SET UP FOR GBPJPYAnalysis: Utilizing chart patterns, highs & lows, and impulses & corrections, the focus is on identifying a continuation corrective structure following a breakout.
Entry: The price has reached the upper boundary of a higher time frame (HTF) bearish continuation structure, approaching this zone with an ascending wedge on the mid time frame (MTF). On the lower time frame (LTF), a bearish impulse has developed, and we will be watching for a continuation pattern to pinpoint a potential entry point for the trade.
Expectation: A downward move is anticipated, targeting the lower boundary of the HTF bearish continuation structure.
⚠️ Reminder: Always conduct your own analysis and apply proper risk management, as forex trading involves no guarantees. This is a high-risk activity, and past performance is not indicative of future results. Trade responsibly!

Trading balanceThe price is currently in the resistance zone and has prospects of entering the balance zone. If the balance zone is overcome, the price is able to reach the target near the opposite resistance zone.
GBP/JPY🔹Symbol: GBP/JPY
🔹Price: 193.918
🔹Stop loss: 195.064
🔹Take profit 1: 192.772
🔹Take profit 2: 191.775
🔹Take profit 3: 190.550
🔹Take profit 4: 188.819
🔹Take profit 5: 187.970
Low risk: % 1.5 🟢
📊Check your chart before entering.
♦️Check before use to make sure there is no important news.

Gj outlook Gj never reached my zone and it sold 200 pips.
Won't trade it again till next week.
Will be watching it to see how the structure will form
