02-04-2025 _ Short Term Bullish Idea _ GBPJPY H11- Bullish divergence
2- Price has bounced from Support Zone.
3- Bullish Flag Pattern.
4- AB = CD anticipated.
Therefore, one can expect a move to the upside.
GBPJPY.100.CSM trade ideas

GBPJPY bullish reversal in play. Long from support!Hey traders,
GBPJPY has hit a key support zone, and I’m anticipating a strong bounce from this level. A powerful bullish engulfing candle has just formed on the 4-hour timeframe, swallowing the last three candles—a clear sign of buying pressure!
💡 Trading Idea:
🔹 Entry: Long from 192.90
🔹 Target 1: 193.935
🔹 Target 2: 195.959 (Major resistance)
🔹 Stop Loss: 191.998 (In case support fails)
⚠️ Remember to stick to your trading plan and manage your risk accordingly. This setup presents a great opportunity, but always trade responsibly!
🔥 If you find this idea useful, give it a boost—your support is greatly appreciated! 🚀

GBPJPY Will Grow! Long!
Here is our detailed technical review for GBPJPY.
Time Frame: 1D
Current Trend: Bullish
Sentiment: Oversold (based on 7-period RSI)
Forecast: Bullish
The market is approaching a significant support area 193.194.
The underlined horizontal cluster clearly indicates a highly probable bullish movement with target 197.049 level.
P.S
The term oversold refers to a condition where an asset has traded lower in price and has the potential for a price bounce.
Overbought refers to market scenarios where the instrument is traded considerably higher than its fair value. Overvaluation is caused by market sentiments when there is positive news.
Disclosure: I am part of Trade Nation's Influencer program and receive a monthly fee for using their TradingView charts in my analysis.
Like and subscribe and comment my ideas if you enjoy them!

GBP/JPY Technical Analysis: Bearish Rejection at Key Resistance?This chart represents a GBP/JPY (British Pound / Japanese Yen) 30-minute timeframe analysis. Here are the key takeaways:
Technical Indicators & Levels
Exponential Moving Averages (EMAs)
200 EMA (Blue Line): 193.586 – A long-term trend indicator.
30 EMA (Red Line): 193.182 – A short-term trend indicator.
Key Levels
Resistance Zone (Stop Loss Level): 193.968
Support/Target Zone: 191.628
Current Price: 193.255 (as per the last recorded candle)
Trade Setup & Market Structure
Bearish Outlook (Sell Scenario)
The price is approaching a strong resistance zone (193.968), which aligns with the 200 EMA.
The price might reject this level and drop toward the target area of 191.628 (approx. 1.00% downside).
The drawn price path suggests a possible retest of resistance before a bearish move.
Bullish Reversal (Invalidation of Bearish Setup)
If the price breaks and holds above 193.968, it could invalidate the bearish setup and push higher.
A sustained move above the 200 EMA may indicate a trend shift to bullish.
Conclusion
Bearish bias as long as the price stays below 193.968.
A possible short trade opportunity if resistance holds, targeting 191.628.
Caution: If price breaks above resistance, it could lead to a bullish breakout


ONENTRY ONENTRY
Wait for it !
GBP/JPY Overnight Range Breakout Strategy
Timeframe: 30 Minutes
Session: London Pre-Market (00:00 - 06:30 +2GMT)
Step 1: Identify the Overnight Range
Mark the high and low of the price range between 00:00 - 06:30 (+2GMT).
Wait for a clear breakout with a candle closing above (for longs) or below (for shorts) this range.
Step 2: Apply Fibonacci Levels
After the breakout, use the Fibonacci retracement tool:
Anchor Point 1: Start at the close of the breakout candle.
Anchor Point 2: Drag to the start of the impulse move (first candle of the range).
Key level for entry: 0.5 and 0.35 retracement.
Step 3: Trade Execution
Entry: Enter on a pullback to 0.5 and 0.35 Fib level after the breakout.
Stop Loss :
Long trades: Below the low of the breakout candle’s body.
Short trades: Above the high of the breakout candle’s body.
Take Profit Targets:
TP1: 1.0 Fib (1:1 risk-reward).
TP2: 1.25 Fib extension.
TP3: 1.6 Fib extenasion
TP4: 2.3 Fib extension (runner position).
Step 4: Trade Management
Move SL to breakeven when price hits TP1.

GBPJPY BUYSWe are will bullish on GBPJPY, price is currently rejecting off an AOI around 192.41. We will ignore the London open trade as theres is no visible level of entry, we will how ever prepare for NYC open. where we will see price take out the London lows for a continuations of the bullish rally.

GBPJPY BUY NOW!!GBPJPY formed a bullish rectangular on the 2h time frame and price have already made a strong rejections from the sell side by sweeping liquidity am in now on buy holding watching to see price take out the buyside to create new highs
JOIN AND ENJOY
Lets know your thoughts on this...........

CHECK GBPJPY ANALYSIS SIGNAL UPDATE > GO AND READ THE CAPTAINBaddy dears friends 👋🏼
(GPBJPY) trading signals technical analysis satup👇🏼
I think now (GBPJPY) ready for( BUY )trade ( GBPJPY ) BUY zone
( TRADE SATUP) 👇🏼
ENTRY POINT (192.950) to (192.850) 📊
FIRST TP (193.300)📊
2ND TARGET (194.700) 📊
LAST TARGET (194.200) 📊
STOP LOOS (192.200)❌
Tachincal analysis satup
Fallow risk management

GJ-Thu-3/04/25 Top down analysis-GJ wide htf consolidation!Analysis done directly on the chart
Just like back in second week of March, GU
started to create wider and wider range. This is
the time where GJ has been consolidating high
time frame until clearer structure is formed.
Not financial advice, DYOR.
Market Flow Strategy
Mister Y

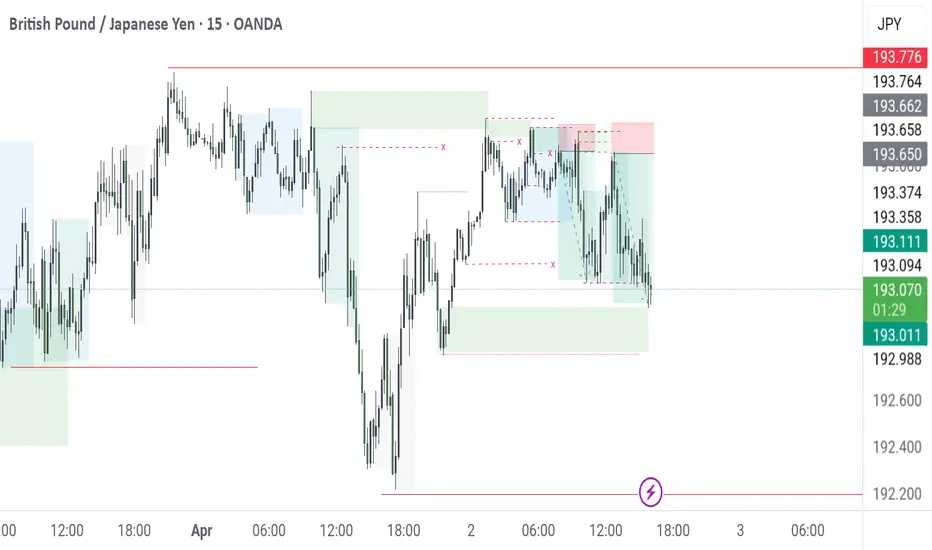
(GBP/JPY) Technical Analysis – April 3, 2025 (GBP/JPY) Technical Analysis – April 3, 2025 📈
🔹 Current Price: 192.935
🔹 Timeframe: 15M
📌 Key Support Levels (Demand Zones):
🟢 192.500 – Major Support Zone
📌 Key Resistance Levels (Fair Value Gaps - FVGs & Supply Zones):
🔴 193.273 – First Target
🔴 194.588 – Major Resistance (Potential Target)
📈 Bullish Scenario:
GBP/JPY is forming a potential bullish structure.
A breakout above 193.273 could push prices toward 194.588.
📉 Bearish Scenario:
If GBP/JPY fails to hold above 192.500, a drop towards lower support levels could be expected.
⚡ Trading Tip:
✅ Wait for confirmation before entering long positions.
✅ Watch for rejection at resistance levels for potential reversals.
✅ Use proper risk management and set stop losses strategically.
#GBPJPY #Forex #TechnicalAnalysis #SmartMoney #PriceAction #Trading

GBPJPY Buy Setup – Bullish Momentum Building From 4H SupportPrice has respected the 4H support zone around 192.300 and is now showing bullish signs on both the 1H and 23m charts, with MACD shifting upward. A break and close above 193.000 could confirm a bullish push.
Trade Plan:
• Entry: Break & retest or strong bullish close above 193.000
• TP1: 193.751 (1H Resistance)
• TP2: 194.907 (4H Resistance)
• SL: Below 192.200 (structure break zone)
Watching closely for volume and momentum confirmation. Let’s see if bulls take control.
#GBPJPY #ForexTrading #PriceAction #MACD #SupportAndResistance #BreakoutSetup #Scalping #SwingTrade

GBPJPY-BUY strategy 6-hourly Line Brk (2)The pair is trading within a wide band, and basing on current state, there is upward pressures for the pair. We may likely see a move back towards 195.00 short-term.
Strategy BUY @ 193.30-193.60 and take profit near 194.78 for now.

#GBPJPY: +250 Pips From Last Idea Expecting A Strong Bulls! The GBPJPY currency pair experienced a decline to the 190 area, which represents a discounted price range. Subsequently, the price reversed positively by approximately 250 pips. Our market analysis remains unchanged, and we anticipate that the price will continue to exert dominance.
It is possible that the price may experience a correction or a downward movement, as we anticipate the release of strong economic data this week. This data is likely to influence the future trajectory of the currency pair.
We encourage you to like and comment for further insights. Your support has been invaluable throughout our journey, and we sincerely hope that you achieve success in your own market endeavours.
Team Setupsfx_
❤️🚀

GBPJPY: Pullback From Support It is likely that 📈GBPJPY will continue to rise from the underlined support zone.
The formation of an inverted head and shoulders pattern suggests significant bullish pressure.
There is a good chance that the price will increase to levels around 194.99/195.66.

#GBPJPY Buy 192.6 - 192.4💎 #GBPJPY Buy 192.6 - 192.4 💎
Stoploss 192.0
Breakeven 192.65
TakeProfit 1: 192.8
TakeProfit 2: 193.6
TakeProfit 3: 195.0
TakeProfit 4: 196.2
TakeProfit 5: 197.4
Trade at your own risk
Protect your capital
The Wizard 🧙♂️
TUESDAY 04/01/2025 10 AM EST


Gj outlook Market has respected the Demand.
We can see large volume kicking in the market.
Int. Structure has shifted bullish.
I'll be looking for buys ones price triggers my alert

Gj outlook Currently price is trading at a strong demand.
Buys will only be possible if their is a structure shift on the LTF.
I'll be monitoring the trade waiting to see how it will unfold

Gj trade outcome Gj dropped 50 pips from the furst entry
Came and retested the supply and dropped another 50 pip.
Not a bad day today
GBP/JPY showing the Bulls some love !!As i write this down GBP/JPY teases us with a triangle on a 1h timeframe with a break and test... and maybe a confirmation?
195.00 level is also there - giving us extra confirmation
the YEN showed some strength since the year began maybe because of the ongoing Japanese fiscal year ending up in march,
but since we are talking about fiscal years, UK's fiscal year concludes in April ! ( during fiscal year end companies tend to repatriate their offshore capital for several reasons: Tax Optimization, Financial Reporting, Dividend Payments, Debt Servicing, Currency Exchange Considerations, Strategic Investments) - this ensure a increased demand for the specific currency making it raise in value ( supply and demand 101)
so where are we at right now:
- Fundamentals favor the GBP in the near term future ( other fundamentals must be taken into consideration - do some research tell me what you find)
- Technically we see an opportunity to profit for the coming fundamentals even tough is a good chance this setup is not the start line of the race upwards
when it comes to Taking profits the only level that comes into mind is 198.200 (not a guarantee but a possibility)
- Other Technical's
the currency sits above the YTD Anchored VWAP and the march Anchored VWAP for some time now,
in terms of Market Structure we see higher highs on the 4h/Daily and previous highs taken out ( feb high and Jan high) - this an uptrend no doubt
For day traders:
on the lower timeframes we see some head & Shoulders formations gearing up
1min_ chart completed H&S
5m_chart H&S in construction -
and if I'm stretching my luck a bit maybe another H&S on the 15 min
that's all there is to it!
Whatever your trading remember to take the risks into consideration and always do your own analysis before taking a decision !!
I'm still new to sharing ideas on the community - don't start throwing rocks now if your Bearish :D
-Not financial Advice !

CHECK GBPJPY ANALYSIS SIGNAL UPDATE > GO AND READ THE CAPTAINBaddy dears friends 👋🏼
(GPBJPY) trading signals technical analysis satup👇🏼
I think now (GBPJPY) ready for( BUY )trade ( GBPJPY ) BUY zone
( TRADE SATUP) 👇🏼
ENTRY POINT (192.200) to (192.100) 📊
FIRST TP (193.600)📊
2ND TARGET (194.600) 📊
LAST TARGET (194.800) 📊
STOP LOOS (192.400)❌
Tachincal analysis satup
Fallow risk management

GBP/JPY SELL SETUP 250 PIPS1️⃣ Macro Fundamental Analysis (GBP vs. JPY)
🔹 Interest Rate Differentials (Carry Trade Impact)
Bank of England (GBP)
The BoE has kept rates high to fight inflation.
Higher GBP rates → capital inflows into GBP assets.
Bullish for GBP/JPY.
Bank of Japan (JPY)
BoJ is still ultra-dovish, keeping negative/low interest rates.
Japan’s government wants a weak yen to support exports.
Bearish for JPY, Bullish for GBP/JPY (carry trade flows into GBP).
📊 Institutional View:
Hedge funds & large investors prefer long GBP/JPY due to high interest rate spreads.
GBP/JPY remains fundamentally bullish due to carry trade inflows.
🔹 Global Risk Sentiment (Risk-On vs. Risk-Off)
GBP/JPY is a "risk-on" pair → it rises when markets are bullish and falls when investors seek safety.
If stock markets are bullish, GBP/JPY tends to rise.
If there’s a global crisis, investors move into JPY (safe-haven), causing GBP/JPY to fall.
Current Market Sentiment:
Stock markets are uncertain, but no full risk-off move yet.
Watch equity markets & US bond yields for risk sentiment confirmation.
📊 Institutional View:
Mild risk-on bias → GBP/JPY has support, but volatility remains high.
🔹 Institutional Positioning (COT Data & Hedge Fund Flows)
Hedge funds have been buying GBP against JPY due to the rate differential.
Commitment of Traders (COT) Report:
Shows institutional investors are still net long GBP/JPY but reducing positions.
Some profit-taking could lead to short-term downside.
📊 Institutional View:
Long-term institutional bias is bullish, but hedge funds may reduce positions if risk-off sentiment increases.
2️⃣ Technical Analysis (ITPM Style) – Multi-Timeframe Breakdown
🔹 GBP/JPY (Daily Timeframe)
📈 Trend: Still in an uptrend, but approaching resistance.
📌 Key Resistance: 195.00 - 196.00
📌 Key Support: 191.00 - 190.00
🔹 Price is struggling at resistance near 194.00.
🔹 Possible pullback to 191.50 - 192.00 before resuming higher.
🔹 GBP/JPY (H4 Timeframe)
📉 Short-Term Weakness, but Still in an Uptrend Channel
📌 Key Level to Watch: 192.50 - 193.00
🔹 Bearish Rejection at 194.00, but still inside an uptrend structure.
🔹 If price breaks below 192.50, a deeper correction to 191.00 is likely.
🔹 GBP/JPY (H1 Timeframe)
📉 Intraday Weakness, Watch 192.50 for Breakdown
📌 Key Levels:
Resistance: 193.50 - 194.00
Support: 192.50 (short-term support), 191.50 (stronger support)
📊 Institutional View:
Intraday traders may take short positions below 192.50, targeting 191.50 - 191.00.
3️⃣ Institutional Trade Setup (ITPM Style)
🔴 Bearish Scenario (Short-Term Correction)
Entry: Sell below 192.50 (Break of key support).
Target: 191.50 → 190.00 (support zone).
Stop-Loss: Above 193.50.
Rationale: Short-term hedge funds taking profits → minor pullback in bullish trend.
