GBP/JPY Downward CorrectionDouble Top completed. Downward correction move to about 192.077 if Double Bottom is respected. If further pushed, TP2 is around 191.176 to the start of the move. Prediction is bullish on higher timeframe at TP2 zone.
GBPJPY.100.CSM trade ideas

GBPJPY SellsSell GBPJPY scenario. This looks like a bearish flag pattern forming. If we can get a break out on the rising support it would be great. Price may decline to as low as 191,0

check the trendConsidering the price behavior in the current resistance level, possible scenarios have been identified. As long as the price fluctuates above the green support level, the continuation of the upward trend is likely.

TODAY’S GBPJPY WONDERMAP!TODAY’S GBPJPY WONDERMAP!
Bulls might be waking up! Price sitting on a strong RBS zone, momentum is key!
📍 Key Levels to Watch:
🟢 Buy Setup: Looking for a pullback to H4 support, H1 breakout, M15 RBS, and M30 swap zone before continuation to the upside.
Stay sharp, follow structure, and let’s wrap up the week in style!

GBP/JPY 15M Analysis & Trade Setup – 21-01-2025📊 GBP/JPY 15M Analysis & Trade Setup – 21-01-2025
📈 Current Price: 193.374
🔴 Supply Zones (Resistance):
✔ 193.269 (Current resistance, waiting for confirmation)
✔ 194.603 (Higher resistance zone)
🟢 Demand Zones (Support):
✔ 192.198 (Potential support level)
📌 Market Outlook:
Price is testing the 193.269 supply zone.
Scenario 1: If price rejects this level, expect a drop towards 192.198 support.
Scenario 2: If price breaks above 193.269 and confirms, it may target 194.603 resistance.
⚡ Trade Setup:
🔻 Sell Setup: If rejection at 193.269
🎯 TP1: 192.198
🛑 SL: Above 193.500
🔼 Buy Setup: If breakout above 193.269 with retest
🎯 TP1: 194.603
🛑 SL: Below 193.000
#GBPJPY #ForexTrading #PriceAction #SmartMoney #TradingAnalysis 🚀📊

Rising Wedges
The image illustrates rising wedges and the prevailing trend, suggesting a strong sell signal on the H4 chart (with the rising wedges completing on the H1 chart). Please proceed with caution and trade at your own risk.

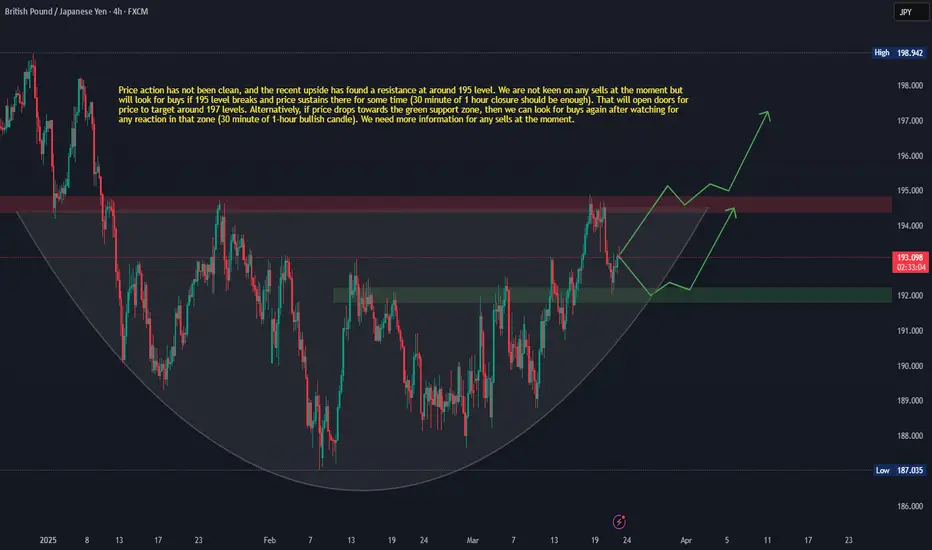
GBPJPY Daily AnalysisPrice action has not been clean, and the recent upside has found a resistance at around 195 level. We are not keen on any sells at the moment but will look for buys if 195 level breaks and price sustains there for some time (30 minute of 1 hour closure should be enough). That will open doors for price to target around 197 levels. Alternatively, if price drops towards the green support zone, then we can look for buys again after watching for any reaction in that zone (30 minute of 1-hour bullish candle). We need more information for any sells at the moment.

GBP/JPY Monthly Chart Analysis We are seeing a classic technical squeeze, with price action moving between two key trendlines:
Green Trendline (Bullish Support): This ascending trendline has been respected since mid-2020, marking a strong uptrend. Each pullback has been met with higher lows, keeping the bullish momentum intact.
Red Trendline (Bearish Resistance): Since late 2023, GBP/JPY has been making lower highs, creating a descending trendline. This forms a clear triangle pattern, signaling indecision and tightening price action.
Current Situation: Price is at a critical point, trading right where the bullish support and bearish resistance converge. A breakout in either direction could signal the next major move:
Potential moves:
Break above the red trendline = Potential continuation of the long-term uptrend.
Break below the green trendline = Possible trend reversal, opening room for deeper downside.
The next few monthly candles will be crucial—watch for strong closes outside the triangle.

ASIAN SESSION TRADERSGBP/JPY 30M - I thought I would provide you all with my thoughts on the GBP/JPY pair for those of you who trade during the Asian session. You can see here there some good opportunity.
We have recently seen price break structure to the upside fractally, giving us the suggestion that enough Demand has been introduced from the Zone below to instigate the next higher timeframe impulse to the upside.
In order for us to enter long in this market we want to see price pullback again fractally down and into the new, more refined Demand Zone I have gone ahead and provided.
Once price does that in order to have confirmation to long we want to see rejection and a fractal BOS to the upside, for those that are more pre-emptive this could be a pending order you could look to set:

gbpjpy travell monthly to monthlyOANDA:GBPJPY monthly to monthly travell
buy the entry position
dayilly support going to monthly support

GBPJPY uptrend supported at 191.40The GBP/JPY currency pair shows a bullish sentiment, reinforced by the prevailing uptrend. Recent intraday price action indicates a corrective pullback toward the previous consolidation zone and the rising trendline support area.
Bullish Scenario:
The key trading level to watch is 191.40, which represents the previous consolidation range. A successful bullish bounce from this level could target the 195.00 resistance, with potential continuation toward 195.66 and 198.30 over the longer timeframe.
Bearish Scenario:
However, a decisive break below 191.40 with a daily close below this level would invalidate the bullish outlook. This would signal a potential shift to a bearish trend, with downside targets at 189.65 and, subsequently, 187.00.
Conclusion:
The bullish sentiment remains intact as long as 191.40 holds as support. Traders should look for bullish confirmation at this level to sustain upward momentum. A break below 191.40 would indicate a deeper retracement and potential trend reversal.
This communication is for informational purposes only and should not be viewed as any form of recommendation as to a particular course of action or as investment advice. It is not intended as an offer or solicitation for the purchase or sale of any financial instrument or as an official confirmation of any transaction. Opinions, estimates and assumptions expressed herein are made as of the date of this communication and are subject to change without notice. This communication has been prepared based upon information, including market prices, data and other information, believed to be reliable; however, Trade Nation does not warrant its completeness or accuracy. All market prices and market data contained in or attached to this communication are indicative and subject to change without notice.

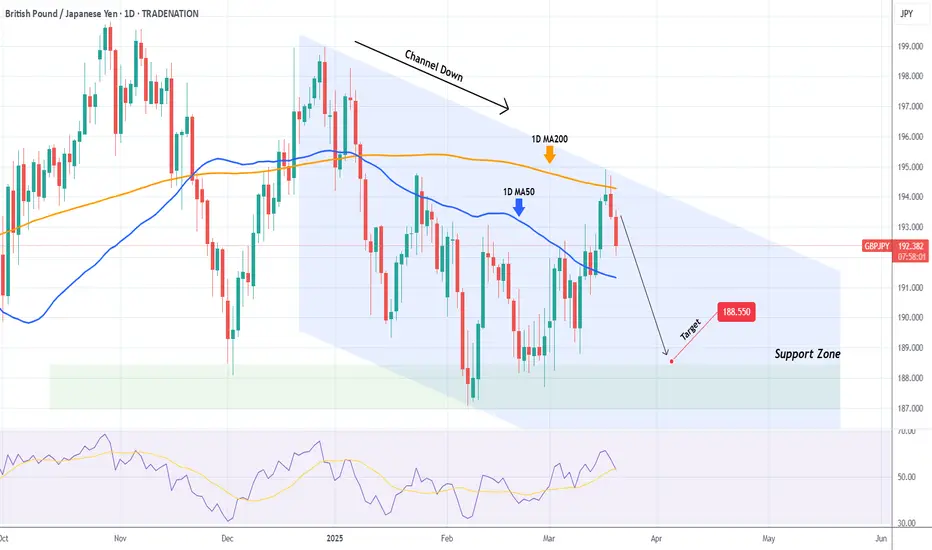
GBPJPY 1D MA200 rejection. Channel Down sell signal.The GBPJPY pair has been trading within a Channel Down pattern and the recent Bullish Leg got rejected yesterday on the 1D MA200 (orange trend-line). If the 1D RSI closes below its MA trend-line, we will have the ideal sell confirmation signal.
Our Target is the top of the 4-month Support Zone at 188.550.
-------------------------------------------------------------------------------
** Please LIKE 👍, FOLLOW ✅, SHARE 🙌 and COMMENT ✍ if you enjoy this idea! Also share your ideas and charts in the comments section below! This is best way to keep it relevant, support us, keep the content here free and allow the idea to reach as many people as possible. **
-------------------------------------------------------------------------------
Disclosure: I am part of Trade Nation's Influencer program and receive a monthly fee for using their TradingView charts in my analysis.
💸💸💸💸💸💸
👇 👇 👇 👇 👇 👇
GBPJPY: 200 is Important Key Level!!Dear Traders,
Price has been moving nicely since our last analysis on gbpjpy, currently GJ is making correction. However, we expect price to bounce straight back up from the area that is shown.

Entry at Key Level & High-Value VWAPI have planned an entry on GBP/JPY around a key level that aligns with a high-value VWAP from the second week's low of this month. This VWAP has shown strong Rhythm being tested, reinforcing its significance as a key reference point. Given its ability to attract liquidity and provide structural support, I consider this level to be a high-probability area for a reaction.
Since there are currently no significant fundamental factors affecting the British pound or the Japanese yen, I am basing this setup entirely on price action and technical confluence. I will wait for confirmation on lower timeframes before executing the trade.

eurjpy buy signal. Don't forget about stop-loss.
Write in the comments all your questions and instruments analysis of which you want to see.
Friends, push the like button, write a comment, and share with your mates - that would be the best THANK YOU.
P.S. I personally will open entry if the price will show it according to my strategy.
Always make your analysis before a trade

GBP/JPY Recent Entry Breakdown – Bearish Move Analysis1. Entry Point – Bearish Confirmation
🔹 Break of the Uptrend:
The price was following a well-defined ascending trendline until it broke below it.
A bearish candle closed below the trendline, confirming a structure shift.
🔹 Retest and Rejection:
Price retested the broken trendline and previous support zone, but failed to break back above.
The dark gray box highlights the supply zone, where sellers stepped in aggressively.
Strong bearish rejection candles confirmed that buyers were weak.
🔹 Entry Trigger:
The entry likely happened after the retest rejection, possibly on a bearish engulfing candle or strong wick rejection.
This ensured that sellers were in control.
2. Stop-Loss Placement
🔺 Above the Retest High (~193.5-194.0):
The SL is safely placed above the rejection zone, avoiding minor pullbacks.
This allows the trade to breathe while keeping risk manageable.
3. Take-Profit Targets
🎯 First Target: 190.5 (Key Support)
🎯 Final Target: 189.0 (Major Demand Zone)
The blue box highlights the potential reward zone, with a Risk-Reward Ratio of approximately 1:3+, which is excellent.
If price hits 190.5, moving SL to break-even is a smart move to secure profits.
4. Trade Management & Expectations
✅ Bearish Confirmation Factors:
Lower High Formation
Break & Retest of Structure
Strong Rejection at Supply Zone
⚠ Possible Market Reaction:
If price stalls at 190.5, expect a small pullback before continuation.
A break below 190.5 should send price straight to 189.0, where buyers might step in.
Final Thoughts: High-Probability Setup
This GBP/JPY short position aligns perfectly with:
✔ Trendline Break & Retest ✅
✔ Supply Zone Rejection ✅
✔ Strong Risk-to-Reward Ratio ✅

Gbpjpy Hi traders, this is my gj analysis, I still believe gj is still bullish , feel free to share your analysis .

2025.03.20 Short Setup for GBPJPY (Trend Continuation)
Entry like 192.800 - 193.000 area wait for price reset
Stop Loss: Above (recent high)
Take Profit: 192.200 - 192.000

GBPJPY CONTINUATION?208 would be a optional target, but for better target is labeled on charts.
I bet the strong low being made at 180. so becareful on making decisions on your stop loss, I'm still asking about that strong low of 180. are all agree on this.?
This is only my view, but I bet this pair would continue to 219. 219 is my weekly charts view on longterm.
This is not a financial advice. what your thoughts on this? not a fan of this pair GJ.


GBP/JPY LONGGBP/JPY LONG "break of a resistance area and retest it + 50% fib retracement + 50ema dynamic support "

