GBPJPY.100.CSM trade ideas

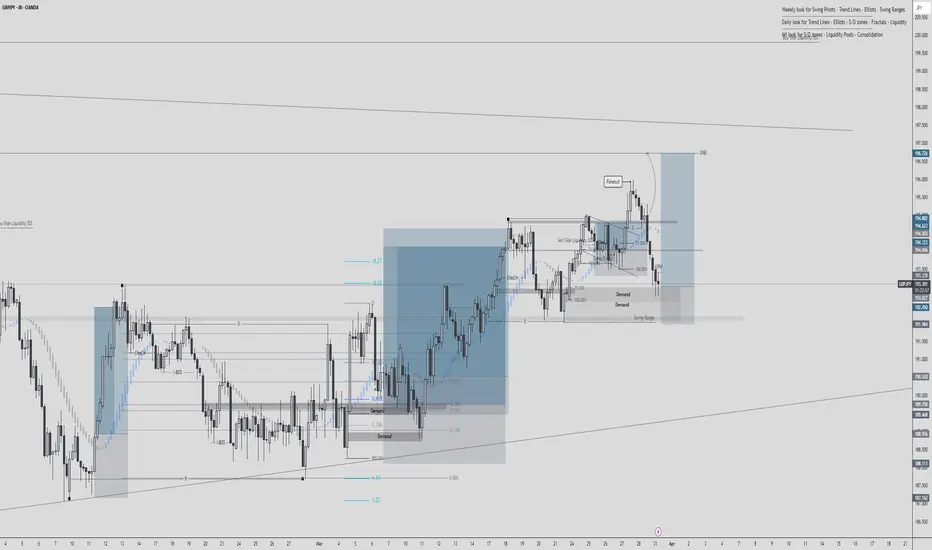
GBPJPYThe pairs this week look so much better than the previous weeks. Probably because we are now moving into Q2. Statistically Q1 is my worst quarter and in Q1 we did pretty decent. Looking at GBJPY this is currently my top pair. So far we have multiple confluences and what we are looking for next is for price to switch structure on the 1hr so we can potentially catch a entry within the zone.

USDJPY and GBPJPY Analysis todayHello traders, this is a complete multiple timeframe analysis of this pair. We see could find significant trading opportunities as per analysis upon price action confirmation we may take this trade. Smash the like button if you find value in this analysis and drop a comment if you have any questions or let me know which pair to cover in my next analysis.

GJ-Mon-31/03/25 Top down analysis-Gap fill?Analysis done directly on the chart
Let's start this trading week strong.
Not financial advice, DYOR.
Market Flow Strategy
Mister Y

GBP/JPY - Market Breakdown/Trade IdeaHi all,
Here we are currently making Higher Highs in the higher TF. We can also see the price is actually consolidating in the Higher TF-In a wedge pattern.
We are still looking for buy positions and currently price is in a pullback stage so we will be looking for an entry around this smaller tf Demand zone
4H - Is displaying a slowing momentum of price from sellers. Looking at this Demand zone I will be waiting for buyers to step in to make a change of character before Buying
Looking to break this Internal Protected High for me to then look for my Lower TF Entry model
Good luck to anyone that follows this trade Idea
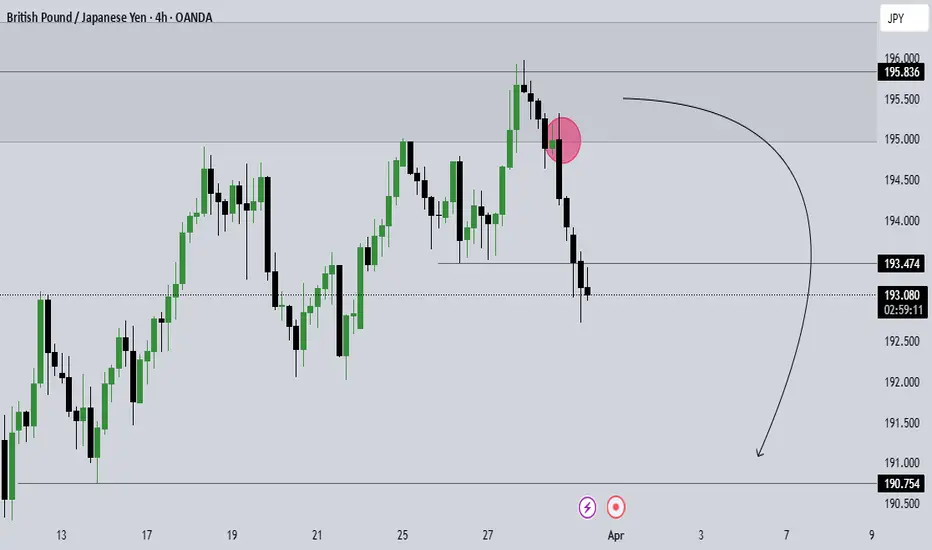
GBPJPY SELL NOW!!!!!!!!GBPJPY price took out the sell side liquidity with a retest price have already made a pull back to the previous lower high and now heading to create a new low am in now on sell holding till 189.076 is completed
Lets see your thoughts on this...........

Correction Given the price behavior within the current support range, a continuation of the downtrend to the specified support levels is possible.

Three Consecutive action conceptAfter years of trading, I noticed a pattern where the market forms three consecutive highs before reversing. The third high often acts as a liquidity grab, trapping buyers before price drops.
How It Works:
First High – Establishes resistance.
Second High – Confirms liquidity above.
Third High – Triggers a stop hunt, followed by a reversal.
If the second high’s order block wasn’t mitigated, price tends to return to it before the drop. This pattern works best when combined with liquidity sweeps, Fair Value Gaps (FVGs), and market structure shifts (MSS) for confirmation.
🔸 Disclaimer: This is based on my personal observations and may not work in all market conditions. Always trade with caution, backtest thoroughly, and use risk management.

GJ SHORTS?price delivered effectivly from weekly zone where we got daily liquidity raid, now i am waiting for price to test the point of interest as marked and confirm my shorts. Trade safely
GBPJPY - Short - 1hr setup on daily structure!Forecasting quite a move on this and other yen pairs, due to an expectation of yen strength for the coming weeks.
The early bird gets a seat in first row, i.e. the best risk to reward ratio, if you keep the trade all the way to the end.
Levels on the chart,
trade with care.

GbpJpy sell ideaI looking for sell gj from the marked zones, but be carefully, price may go up as I described on charts. We have harmonic, divergence and Imbalance to fill.

JPY/GBP - Potential Reversal SetupHey traders! Today we’re diving into a high-probability setup on the JPY/GBP pair with up to 22% upside on the monthly chart. I’ll cover the technicals, fundamentals, and exactly how to trade it.
📉 Chart pattern
Looking at the chart, we’ve got a textbook falling channel stretching back from mid-2020. This descending structure has been consistent, but right now, we’re testing the upper boundary - and that could signal a trend reversal is coming.
Momentum indicators back it up too. The RSI is rising off oversold levels, sitting around 41. And check out the MACD: bearish momentum is fading. Classic setup for a bullish breakout.
📌 Trade setup
Wait for a monthly close above the upper channel , ideally between 0.00530 to 0.00535. That’s your breakout confirmation. You can place a buy stop just above the breakout zone.
Set your stop-loss below the recent swing low - about 0.00490 - to protect against false moves.
Now for the profit targets :
* First target: 0.00580, that’s 12% above current levels.
* Second target: 0.00630, that's 22% upside potential.
That gives you a potential risk-reward ratio of up to 1:4 - solid.
🌐 Fundamentals
On the macro side, this setup makes even more sense. Japan is finally stepping away from ultra-loose monetary policy, possibly hiking rates. Meanwhile, the UK looks set to pause or even cut rates in 2025. That shift could give the Yen the edge over the Pound, driving this move higher.
🛎️ Now, smash that like button if you found this helpful, and subscribe for more trade ideas.

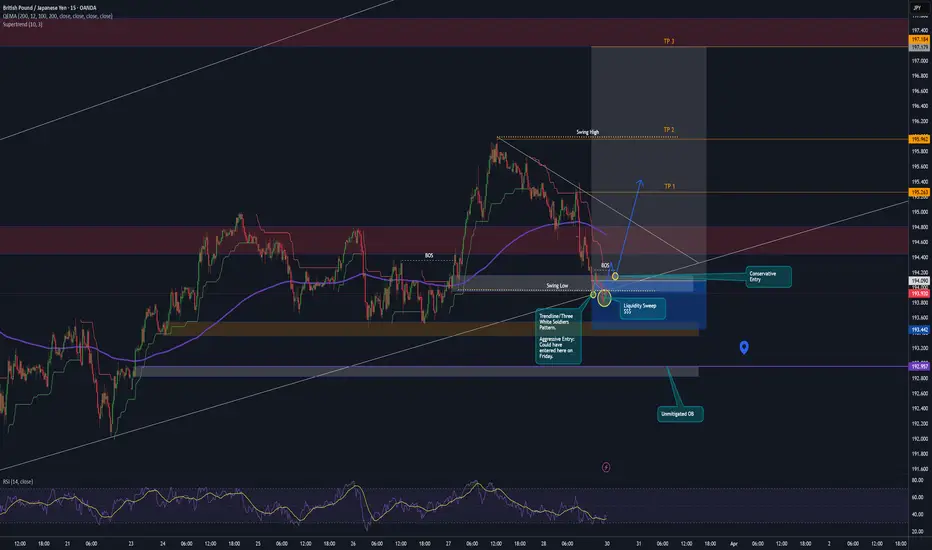
GBPJPY Long Entry Set UpConservative Entry Set Up:
1. Mitigate Swing Low
2. Sweep Liquidity just below swing low
3. Break of Structure/Market Shift
4. Short pull back to 1/5/15min D.Z. for conservative entry
See Friday's Aggressive entry set up on chart.
GBPJPY UPCOMING WEEK SETUPprice rejected from major area upcoming months possibly Japanese yen stronger than pound Clearly auto market are the reason all though uncertainty you can see because of trump tariffs in automobile industry in USA impacting Japan economy and its currency so a bit risk factor is also considered take a small risk and try this trade

CHECK GBPJPY ANALYSIS SIGNAL UPDATE > GO AND READ THE CAPTAINBaddy dears friends 👋🏼
(GPBJPY) trading signals technical analysis satup👇🏼
I think now (GBPJPY) ready for( BUY )trade ( GBPJPY ) BUY zone
( TRADE SATUP) 👇🏼
ENTRY POINT (194.000) to (193.900) 📊
FIRST TP (194.400)📊
2ND TARGET (195.000) 📊
LAST TARGET (195.600) 📊
STOP LOOS (193.200)❌
Tachincal analysis satup
Fallow risk management

GBP/JPY Daily AnalysisThe daily chart shows price is making higher highs and higher lows since price bottomed out at circa 187.00 in February this year.
The moving averages are bullish with angle and separation showing a strong trend.
With price back at the 8 EMA (black line), we may see a change of sentiment on the smaller time frames if it acts as support.
Failing that, we could see price test the 20 EMA (blue line) before buyers come back in (assuming the bullish trend isn't over).
Targets for longs could be the resistance trendline as shown in the image.

My Directional Bias on GBPJPY for the long run {29/03/2025}Educational Analysis says that GBPJPY may give countertrend opportunities from this range, according to my technical analysis.
Broker - FXCM
So, my analysis is based on a top-down approach from weekly to trend range to internal trend range.
So my analysis comprises of two structures: 1) Break of structure on weekly range and 2) External pushback to fill the remaining fair value gap
1) Break of structure on weekly range is down trend for the long run period of 10 years, may be it switch to new character or change its direction to bullish.
2) External pushback structure is the trading range where it trades on the smaller time frame,
On this structure range market on inside trading or smaller time frame is bullish towards fib of 1.618 and make turn to fill the fair value gaps of it.
Let's see what this pair brings to the table for us in the future.
Please check the comment section to see how this turned out.
DISCLAIMER:-
This is not an entry signal. THIS IS ONLY EDUCATIONAL PURPOSE ANALYSIS.
I have no concerns with your profit and loss from this analysis.
I HAVE NO CONCERNS WITH YOUR PROFIT OR LOSS,
Happy Trading, Fx Dollars.

Trade Recap cw13Quick recap of my two positions this week. GBP/JPY and EUR/AUD. Also covering two positions I'm proud of for not taking them.

A Bullish Sentiment on GBPJPYLet's wait and see how price will drop to 192.974
I believe this is a beautiful level to buy... Then let's fly to the 🌙 Moon

GBPJPY | APRIL 2025 FORECAST| Will GJ fly to the SKY?GBP/JPY has been riding strong volatility, reacting to both BOE and BOJ policy shifts. As we head into the new month, the pair is testing a critical resistance zone near , with momentum signaling a potential breakout or rejection.
🔹 Trend Analysis: The pair remains in a strong , with price respecting the as dynamic support/resistance.
🔹 Key Levels: Resistance at , support at . A break above could open the door to .
🔹 Technical Outlook: RSI divergence hints at possible exhaustion, while Fibonacci retracements suggest key reaction zones around .
Will GBP/JPY continue its bullish momentum, or are we looking at a deeper correction? Share your insights below! 📉📈 #GBPJPY #ForexForecast #MarketAnalysis

#GBPJPY Sell 195.5 - 195.7💎 #GBPJPY Sell 195.5 - 195.7 💎
Stoploss 196.1
Breakeven 195.55
TakeProfit 1: 195.3
TakeProfit 2: 194.5
TakeProfit 3: 193.1
TakeProfit 4: 191.9
TakeProfit 5: 190.7
Trade at your own risk
Protect your capital
The Wizard 🧙♂️
THURSDAY 03/27/2025 01 PM EST

GJ Buy Looking forward to buy GJ from this level
I took the 50% level of the dominant break buy candle on 4hr TF..
Just to buy till a weekly supply.

GBP/JPY Bullish Trendline EntryLooks Bullish on the high-time frames. Worth it to take a buy at the trendline. Momentum is also slowing down, which is good as it approaches the trendline to hopefully reverse.
For safety, you can move your stop-loss to B/E once the price hits around 194.792 in case it respects the descending squeeze and wants to break the trendline next week.
