NEW BULLISH MOVEMENT GBPJPY just started new a ascending channel after long term of descending channel. On 4 hours and 1 hours time there is a strong move to the upside which as broken the minor bearish trend to the upside. So i'm in for a BUY now, risking 1%
GBPJPY.100.CSM trade ideas

Trendline breakThe price made a bearish trendline as a pullback, now the price broken out and made a small pullback, now the price looks to a bullish run
WE ONLY TRADE PULLBACKS

GBPJPY The Target Is DOWN! SELL!
My dear subscribers,
This is my opinion on the GBPJPY next move:
The instrument tests an important psychological level 193.00
Bias - Bearish
Technical Indicators: Supper Trend gives a precise Bearish signal, while Pivot Point HL predicts price changes and potential reversals in the market.
Target - 191.639
My Stop Loss - 193.69
About Used Indicators:
On the subsequent day, trading above the pivot point is thought to indicate ongoing bullish sentiment, while trading below the pivot point indicates bearish sentiment.
———————————
WISH YOU ALL LUCK

Mister Y - GJ - Monday - 17/03/25 Top down analysisGm,
Analysis explanation done directly on the chart.
Manage your risks, trade safe. Rinse and repeat.
Mister Y

GBPJPY is in the Down TrendHello Traders
In This Chart GBPJPY HOURLY Forex Forecast By FOREX PLANET
today GBPJPY analysis 👆
🟢This Chart includes_ (GBPJPY market update)
🟢What is The Next Opportunity on GBPJPY Market
🟢how to Enter to the Valid Entry With Assurance Profit
This CHART is For Trader's that Want to Improve Their Technical Analysis Skills and Their Trading By Understanding How To Analyze The Market Using Multiple Timeframes and Understanding The Bigger Picture on the Charts

GBPJPY: +1200 Pips Swing Move in Making! Our last update on GBPJPY we had explained that price will bounce from the area that we had identified. We still think price will bounce again as price currently gathering enough volume before it makes any move.
Like and comment
❤️

Outlook 3-17-25Outlook 3-17-25 = in this video i will discuss what i am gonna trade for the week. This video is for my friends.

gbpjpy sell signal. Don't forget about stop-loss.
Write in the comments all your questions and instruments analysis of which you want to see.
Friends, push the like button, write a comment, and share with your mates - that would be the best THANK YOU.
P.S. I personally will open entry if the price will show it according to my strategy.
Always make your analysis before a trade

uptrendConsidering the price behavior within the current resistance area, possible scenarios have been identified.
The continuation of the upward trend is expected to form and advance to the next resistance areas.


GBJPY Uptrend ContinuationAt 4H & 1H price more bullish leaving demand zone with huge imbalance.
I will waiting or buy limit at 1HR zone and targeted previous high for TP.
Above demand zone, we can see there are significant support formed.
Price probably breaks those sig support and test the demand zone before continue uptrend.

GBPJPY Trade Analysis**GBP/JPY 15-minute chart**
**Trade Analysis & Idea:**
📉 **Previous Downtrend**: The pair experienced a strong drop before finding support around **191.400**.
📈 **Current Recovery**: Price is now rebounding and trading above short-term moving averages (blue & red EMA).
🔄 **Resistance Zone**: The **192.000 - 192.200** area may act as resistance for further upside.
### **Potential Trade Setups:**
1️⃣ **Bullish Continuation**:
- If price **breaks & closes above 192.000**, we could see further upside towards **192.400 - 192.600**.
- A strong candle close above resistance would confirm bullish momentum.
2️⃣ **Rejection & Pullback**:
- If price struggles to hold above 192.000, a pullback toward **191.700 - 191.500** is possible.
- Look for **bearish candlestick patterns** (e.g., rejection wicks, engulfing candles) to confirm a short opportunity.
### **Risk Management:**
✅ Secure partial profits at key levels.
✅ Use **tight stop-loss** below **191.700** for longs or above **192.200** for shorts.

GBPJPY Bear CallLooking to ride the bear down to this fvg on the 4H. We had a strong buy last week and feel the bulls are exhausted. It could drop all the way down to the next major level of support.

GBPJPY LOOKING BULLISHAfter close looking ,with president TRUMP TARRIFFs now and then the GBPJY the buyer are reedy to win big gain with the massive liquidation.

GBP/JPY - Prediction UpdateCurrently Our analysis has been correct showing Bullish movements towards Resistance Zone.
We now have had multiple movements into this zone which tells me im expecting for price to break this ranging market out of this resistance layer towards the new Targets.
This is a long Term movement and I will be holding long Term here until we reach this level
Previous movement has show a large Bullish movement leaving a Small FVG to use as a run away break. Measuring this with the FIB level shows that it is a confirmed OTE Tap giving me more confluence for a solid Bullish movement.
After the OTE tap we have left Behind a Demand zone.
Im already in this trade along with my other traders following me in my private chat
DM for any questions about this
Cheers and Good luck to everyone who will be following

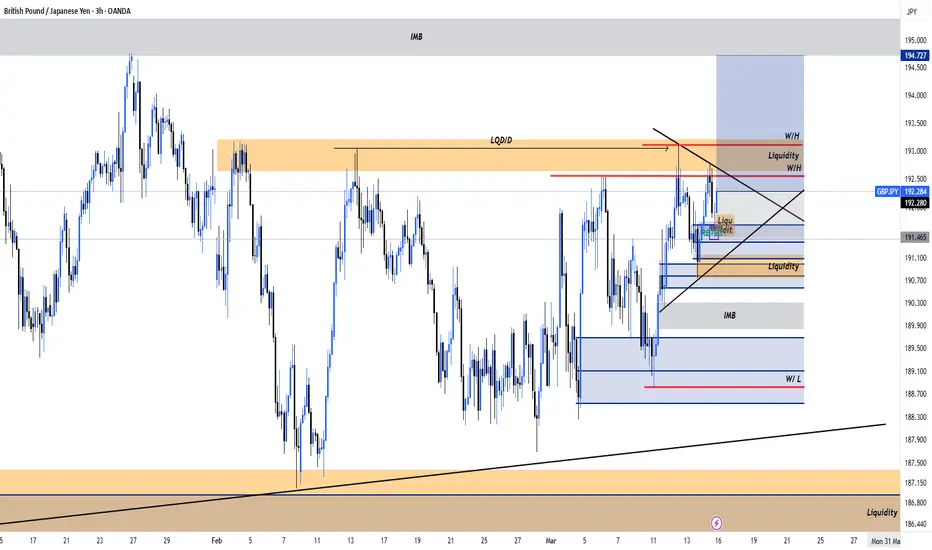
Potential GBPJPY weekly long move / Bull RunOn the 3H time frame I noticed a bullish reversal candlestick and pattern which retested an area of demand which is marked in blue, the bullish reversal candlestick also retested an IMB (Imbalance)
Following the bullish reversal candlestick, price made a bullish reversal candlestick and pattern which looks like it will close bullish when the charts open up again
forecasting this trade with a R&R of 1/3 having my SL at 191.464 and my TP at 194.727
GBPJPY - Higher Probability Favors Upside ContinuationThe GBP/JPY pair is displaying strong bullish momentum as it trades near 192.25, having recently tested but failed to break through the key resistance level at 193.05. After forming a higher low structure within an ascending trendline since late February, the pair shows notable strength with buyers stepping in at each pullback. Technical analysis suggests that the higher probability move is a continuation to the upside, with price likely to break above the horizontal resistance at 193.05 after a possible minor retracement. If this bullish scenario plays out, we could see the pair extend toward the 194.50 level before potentially reaching higher targets as indicated by the upward-pointing arrow on the chart. The ascending trendline and the support zone marked by the blue box near 191.00 should provide solid foundations for this anticipated upward move, keeping the overall bullish bias intact as long as price remains above these key structural levels.
Disclosure: I am part of Trade Nation's Influencer program and receive a monthly fee for using their TradingView charts in my analysis.

GBPJPY 4H GBPJPY Analysis
As long as the 191.3 support (or at most 191) holds, the market remains bullish, activating multiple targets up to the final goal of 197.
High-precision analysis, amazing results!

GBPJPY is in the Down TrendHello Traders
In This Chart GBPJPY HOURLY Forex Forecast By FOREX PLANET
today GBPJPY analysis 👆
🟢This Chart includes_ (GBPJPY market update)
🟢What is The Next Opportunity on GBPJPY Market
🟢how to Enter to the Valid Entry With Assurance Profit
This CHART is For Trader's that Want to Improve Their Technical Analysis Skills and Their Trading By Understanding How To Analyze The Market Using Multiple Timeframes and Understanding The Bigger Picture on the Charts

GBPJPY Will Fall! Short!
Take a look at our analysis for GBPJPY.
Time Frame: 9h
Current Trend: Bearish
Sentiment: Overbought (based on 7-period RSI)
Forecast: Bearish
The market is on a crucial zone of supply 192.236.
The above-mentioned technicals clearly indicate the dominance of sellers on the market. I recommend shorting the instrument, aiming at 190.200 level.
P.S
We determine oversold/overbought condition with RSI indicator.
When it drops below 30 - the market is considered to be oversold.
When it bounces above 70 - the market is considered to be overbought.
Disclosure: I am part of Trade Nation's Influencer program and receive a monthly fee for using their TradingView charts in my analysis.
Like and subscribe and comment my ideas if you enjoy them!

CHECK GBPJPY ANALYSIS SIGNAL UPDATE > GO AND READ THE CAPTAINBaddy dears friends 👋🏼
(GPBJPY) trading signals technical analysis satup👇🏼
I think now (GBPJPY) ready for( SEEL )trade ( GBPJPY ) SEEL zone
( TRADE SATUP) 👇🏼
ENTRY POINT (192.800) to (192.300) 📊
FIRST TP (192.700)📊
2ND TARGET (191.000) 📊
LAST TARGET (190.200) 📊
STOP LOOS (193.300)❌
Tachincal analysis satup
Fallow risk management

GBPJPY: Bearish Continuation & Short Signal
GBPJPY
- Classic bearish formation
- Our team expects pullback
SUGGESTED TRADE:
Swing Trade
Short GBPJPY
Entry - 192.49
Sl - 193.31
Tp - 191.06
Our Risk - 1%
Start protection of your profits from lower levels
Disclosure: I am part of Trade Nation's Influencer program and receive a monthly fee for using their TradingView charts in my analysis.
❤️ Please, support our work with like & comment! ❤️

gbpjpy|foxforexgbpjpy broke the downtrend within the channel. For those who cannot trade from here, there is a resistance at the level of 193,000, and with the break of this resistance, a long position can be held up to the upper channel of the channel.
