CHECK GBPJPY ANALYSIS SIGNAL UPDATE > GO AND READ THE CAPTAINBaddy dears friends 👋🏼
(GPBJPY) trading signals technical analysis satup👇🏼
I think now (GBPJPY) ready for( BUY )trade ( GBPJPY ) BUY zone
( TRADE SATUP) 👇🏼
ENTRY POINT (193.750) to (193.800) 📊
FIRST TP (194.000)📊
2ND TARGET (194.300) 📊
LAST TARGET (193.500) 📊
STOP LOOS (193.500)❌
Tachincal analysis satup
Fallow risk management
GBPJPY.100.CSM trade ideas
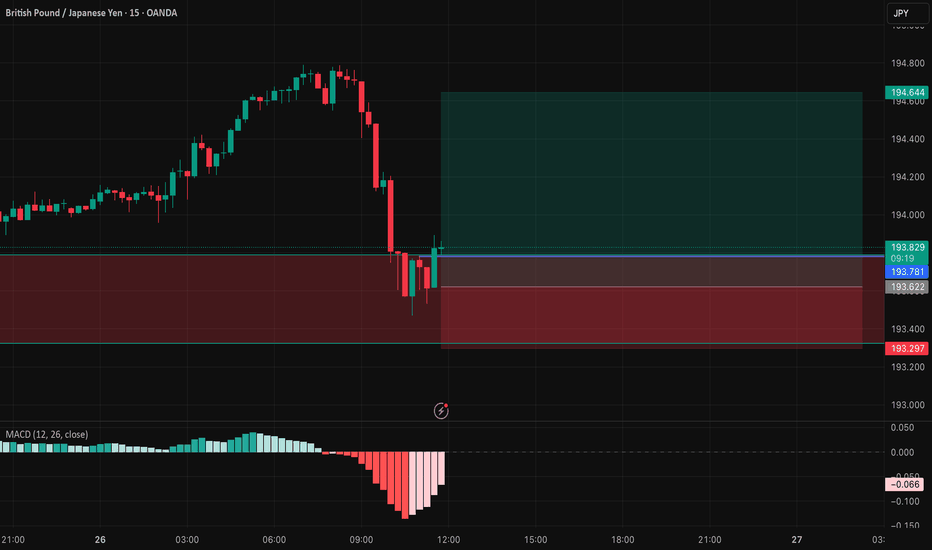
GBPJPY 15 min Long IdeaHello Friends,
GBPJPY has successfully grabbed the liquidity, and now its showing signs to go upwards after tapping into the demand zone.
Entry = 193.622
SL = 193.297
TP = 194.64
Please like, share, and follow for more ideas and comment to start our conversation. I will be glad to talk with like minded people.
Thanks
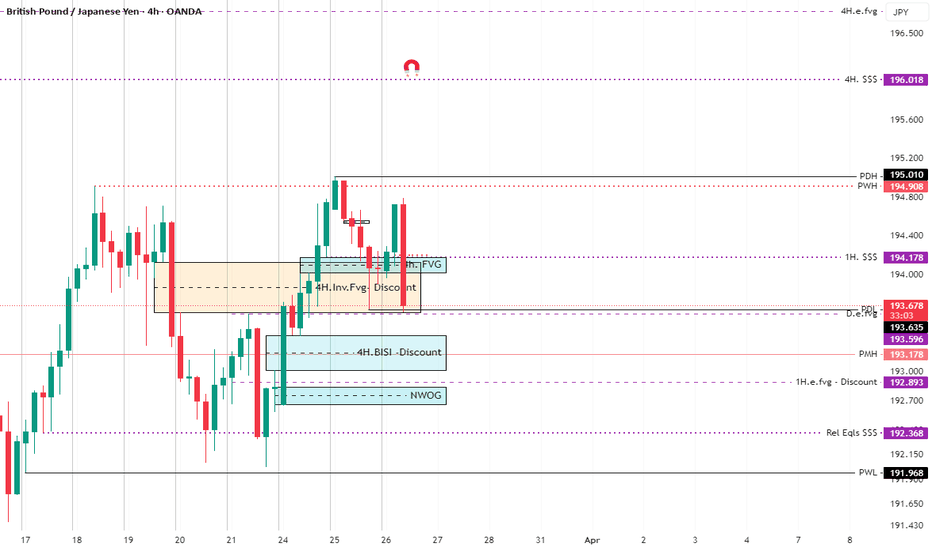
GBPJPY LONG CONCEPTYesterday's sell idea was based on what I shared yesterday. If you did not see it, kindly check it out, it'll expand your knowledge based on the factors that I shared.
Back into the uptrend concept,the current trend is an uptrend.
I'ma update once I see the buy trade.
Follow and boost the idea
BUY GBPJPY after UK Inflation data 200 EMA and Volume ClustersGBPJPY reversed after UK inflation data earlier , however it has retraced to significant 200 EMA level and areas of previous good volume / reversal points ( see chart )
Given also that :
200 Hourly EMA providing technical resistance
Running into a cluster of previous volume areas
Overall recent trend is still bullish
Despite the data this morning giving GBP a push lower , this move appears way too aggressive for the data and likely more position covering than fundamental given that :
Bank of England still expect inflation to peak at 3.75% in Q3
Energy , Tariffs and general uncertainty in the market
Some analysts still calling for 4% in April and May
Stop 192.85
Entry 193.80
Target 194.85
Good risk reward 1:1 good reversal probability given the above observations .
Possible retrace as US markets arrive but overall sentiment remains .
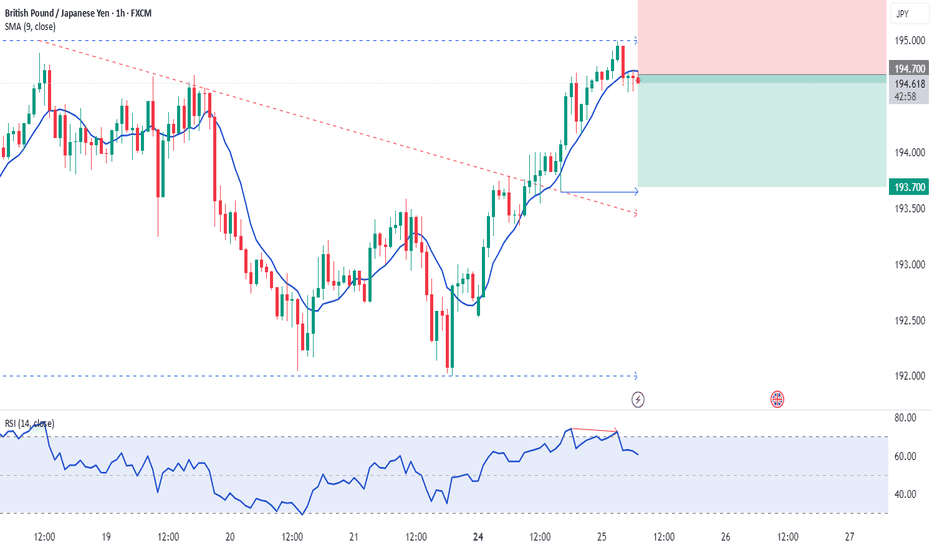
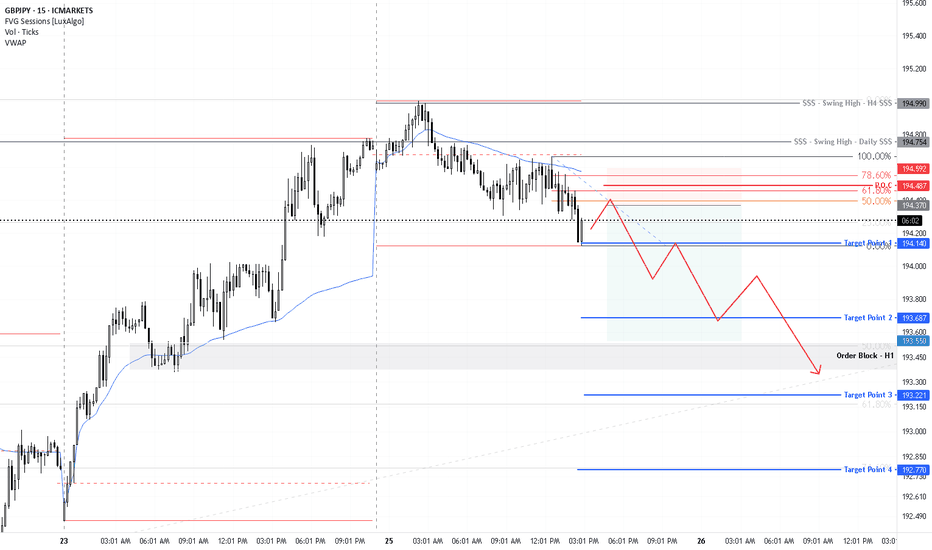
GBPJPY | 26.03.2025SELL 194.900 | STOP 195.600 | TAKE 193.700 | We expect volatile movements in the instrument against the background of the data published today. The price is likely to consolidate firmly below the 194,000 level, followed by the formation of a medium-term downward movement towards the targets of 192.700-192.000.
The Trend Is Always Your Friend (GBPJPY)Our analysis is based on multi-timeframe top-down analysis & fundamental analysis.
Based on our view the price will rise to the monthly level.
DISCLAIMER: This analysis can change anytime without notice and is only for assisting traders in making independent investment decisions. Please note that this is a prediction, and I have no reason to act on it, and neither should you.
Please support our analysis with a like or comment!
Let’s master the market together. Please share your thoughts and encourage us to do more by liking this idea.
GBP/JPY - 30M Analysis & Key Levels📉 GBP/JPY - 30M Analysis & Key Levels
🔵 Current Price: 194.630
🔴 Supply Zone (Resistance): 194.610 - 194.685
🟢 Demand Zone (Support): 193.696 - 193.705
🔍 Possible Scenarios:
1️⃣ Bearish Case: If price respects the 194.610 - 194.685 supply zone and rejects, we could see a drop towards 193.705 support.
2️⃣ Bullish Case: If price breaks and closes above 194.685, it may invalidate the bearish setup and push towards higher levels.
💡 Trading Plan:
✅ Look for potential short entries near 194.610 - 194.685 if rejection occurs.
✅ Target 193.705 as a downside objective.
✅ If price breaks above 194.685, avoid shorts and reassess for potential bullish setups.
Would you like additional insights on stop-loss or confirmation entries? 📊🔥
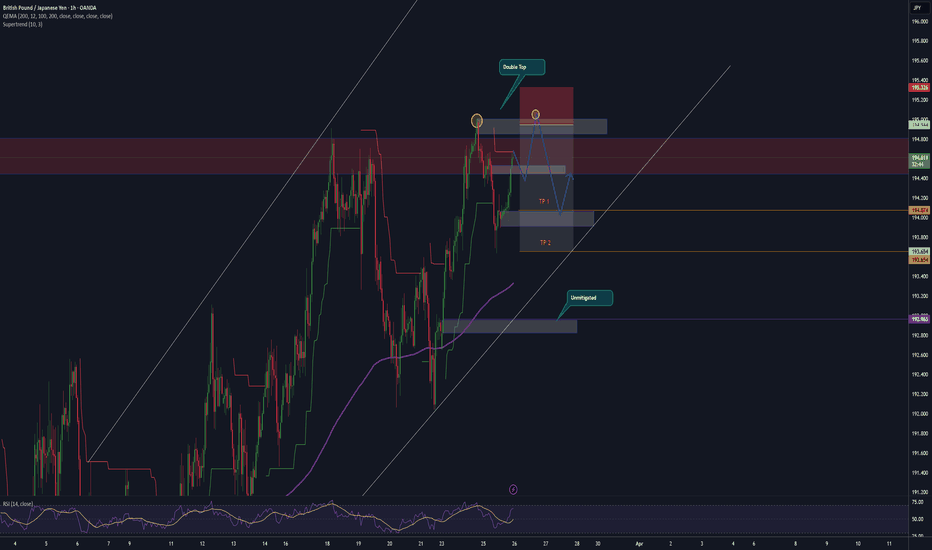
GBP/JPY Double Top Entry IdeaThe pair has been respecting double tops and double bottoms very well. Liquidity needs to be swept before the market can push higher but understand it may be ready to mitigate price below if the market breaks the channel. Bullish on higher timeframes. AS always, bear in mind your entries and exits and be patient. Risk management.
GBPJPY Bullish Breakout Setup – Eyes on 195.000+Structure: Symmetrical Triangle inside Bullish Channel
Analysis:
GBPJPY is currently compressing within a symmetrical triangle formation after a strong bullish rally. Price has pulled back and is respecting the ascending channel and trendline support around 193.900. MACD is flattening, suggesting potential build-up before the next push.
We are watching for a bullish breakout of the triangle, with confirmation via a strong candle close above 194.200 and EMA cross to the upside.
⸻
Trade Plan:
Entry:
Above 194.200 on strong bullish breakout candle (23min or 1H confirmation)
Stop Loss:
193.700 (below triangle structure and trendline support)
Take Profit Targets:
• TP1: 194.667 (recent high + trendline intersection)
• TP2: 195.000 (psychological resistance + channel top)
• TP3: 195.500 (extension play if momentum builds)
Risk/Reward: Approx. 1:2 to 1:3 depending on entry execution
⸻
Confirmation Factors:
• Triangle consolidation nearing breakout point
• Bullish channel still intact
• MACD showing flattening / crossover setup
• Price respecting 50/144 EMA zones
⸻
Invalidation:
If price breaks below 193.700 and fails to hold the ascending structure, bullish bias is off the table for now.
GBPJPY Trade Idea – Eyeing Short from 194.100We’re monitoring the 194.1 level for potential short opportunities. While buyers have been in control, momentum is beginning to show signs of slowing down, suggesting the current uptrend may be running out of steam.
Price is starting to form a potential top near a key resistance zone. If this level holds, we could see a pullback in the coming session
Our approach? Look to sell into strength—specifically around the 194.1 resistance, which aligns with our custom zone. As always, we’ll wait for confirmation and let the market lead.
This is a short bias with caution—if price breaks and holds above, we’ll step aside.
GBP/JPY: Bullish Momentum Builds Near Key ResistanceThe GBP/JPY market is currently developing an ABC pattern, with point C forming near the 196.000 level. Recently, the price broke above both a downward trendline and the 194.000 support, signaling a potential shift in momentum.
At present, the pair is testing last week’s high, which aligns with the 195.000 psychological level. A strong bullish candle has emerged on the daily chart, indicating growing bullish pressure. The market may enter a consolidation phase around this level before attempting a breakout above the previous week’s high. The next target is the resistance zone at 195.750


