Bullish bounce?GBP/JPY is falling towards the pivot and could bounce to the 1st resistance.
Pivot: 191.16
1st Support: 189.22
1st Resistance: 194.56
Risk Warning:
Trading Forex and CFDs carries a high level of risk to your capital and you should only trade with money you can afford to lose. Trading Forex and CFDs may not be suitable for all investors, so please ensure that you fully understand the risks involved and seek independent advice if necessary.
Disclaimer:
The above opinions given constitute general market commentary, and do not constitute the opinion or advice of IC Markets or any form of personal or investment advice.
Any opinions, news, research, analyses, prices, other information, or links to third-party sites contained on this website are provided on an "as-is" basis, are intended only to be informative, is not an advice nor a recommendation, nor research, or a record of our trading prices, or an offer of, or solicitation for a transaction in any financial instrument and thus should not be treated as such. The information provided does not involve any specific investment objectives, financial situation and needs of any specific person who may receive it. Please be aware, that past performance is not a reliable indicator of future performance and/or results. Past Performance or Forward-looking scenarios based upon the reasonable beliefs of the third-party provider are not a guarantee of future performance. Actual results may differ materially from those anticipated in forward-looking or past performance statements. IC Markets makes no representation or warranty and assumes no liability as to the accuracy or completeness of the information provided, nor any loss arising from any investment based on a recommendation, forecast or any information supplied by any third-party.
GBPJPY.100.CSM trade ideas

GBPJPY: Potential Inverse Head and Shoulders PatternGBPJPY: Potential Inverse Head and Shoulders Pattern
GBPJPY is showing the possibility of forming a potential Inverse Head and Shoulders Pattern. The fundamental situation related to the Bank of Japan (BOJ) remains a bit confusing.
Government data released on Friday indicated that Japan's consumer prices are on track toward the BOJ's goal of achieving stable 2% inflation. However, this data wasn't strong enough to push the BOJ to rush into the next interest-rate hike, according to market analysts.
If GBPJPY continues its current bullish movement, a very strong resistance zone will be found near 191.90. A movement above this area will definitely confirm our pattern, and GBPJPY may continue to rise further to 194.30 and 197.80 in the coming days.
You may find more details in the chart!
Thank you and Good Luck!
❤️PS: Please support with a like or comment if you find this analysis useful for your trading day❤️
Disclosure: I am part of Trade Nation's Influencer program and receive a monthly fee for using their TradingView charts in my analysis.

Weekly outlookThis video i will show my accountabilty my video for the week what i am gonna to trade.

Potential trade for GBPJPYI'm looking for the smaller timeframe to break to the upside. But I'm expecting most bearish movement when the market opens

Potential bullish setup on GBPJPYGBPJPY has been stuck on a nasty range we finally saw price broke to the upside. if buyers still manage to stay in control in the next coming week, we may see price test a key level

CHECK XAUUSD ANALYSIS SIGNAL UPDATE > GO AND READ THE CAPTAINBaddy dears friends 👋🏼
(GPBJPY) trading signals technical analysis satup👇🏼
I think now (GBPJPY) ready for( BUY )trade ( GBPJPY ) BUY zone
( TRADE SATUP) 👇🏼
ENTRY POINT (192.900) to (192.800) 📊
FIRST TP (193.100)📊
2ND TARGET (193.400) 📊
LAST TARGET (193.700) 📊
STOP LOOS (192.400)❌
Tachincal analysis satup
Fallow risk management

GBPJPYinternal structure in Weekly in probably become bearish soon, but we need a confirmation
Daily its on the same idea as weekly, we will need a shift on H4 before anything

GBP JPY SHORTLast trade of the week, I hope it will be favorable, maybe if it does not arrive tonight and in the new york session, I recommend you to take profit, because on Sunday when the asian market opens, gaps may occur, let's see how much the market will give us this day.

UJ trade breakdown and market update.UJ trade breakdown and market update. GJ and JP225 covered.
Also..what does Oli do?!?!?!?!? lol

Trading balanceThe price of the asset has rebounded from the balance zone. With the prospect of growth into the resistance zone. Targets above the resistance zone.

LONG ON GBP/JPYGJ Has change structure from down to up and is currently in its pullback phase mitigating a FVG to near a demand area.
The JPY index is currently showing bearish.
I will be buying GJ to the next level of resistance looking to catch 145 pips to the upside.

UPDATE ON GBP/JPY TRADEGBP/JPY 30M - Our pending order was just missed late last night, as you can see price didn't quite come down enough to trade into the 50% mark our Demand Zone.
Did any of you Asian Session traders manage to get in manually? I know those of you who are in the UK and Europe probably didn't hence the pending order.
The trade above ran for + 84 pips. (+5%) 5RR
The potential profits from this trade here could have been great for those of you who entered in manually, understandably those of you who typically trade the London and NY probably missed it just like I did.
Nevertheless I wanted to provide you all with the trading opportunity and update you all on how it performed over night, well done to any of you who got in manually based on the penetration and rejection.

CHECK GBPJPY ANALYSIS SIGNAL UPDATE > GO AND READ THE CAPTAINBaddy dears friends 👋🏼
(GPBJPY) trading signals technical analysis satup👇🏼
I think now (GBPJPY) ready for( SEEL )trade ( GBPJPY ) SEEL zone
( TRADE SATUP) 👇🏼
ENTRY POINT (193.350) to (192.250) 📊
FIRST TP (193.100)📊
2ND TARGET (192.800) 📊
LAST TARGET (192.500) 📊
STOP LOOS (193.700)❌
Tachincal analysis satup
Fallow risk management

GBPJPY Will Move Lower! Sell!
Take a look at our analysis for GBPJPY.
Time Frame: 12h
Current Trend: Bearish
Sentiment: Overbought (based on 7-period RSI)
Forecast: Bearish
The market is testing a major horizontal structure 193.249.
Taking into consideration the structure & trend analysis, I believe that the market will reach 191.112 level soon.
P.S
Overbought describes a period of time where there has been a significant and consistent upward move in price over a period of time without much pullback.
Disclosure: I am part of Trade Nation's Influencer program and receive a monthly fee for using their TradingView charts in my analysis.
Like and subscribe and comment my ideas if you enjoy them!

GBPJPY at Key Resistance Level: Will it Drop To 192.000?OANDA:GBPJPY is currently trading at a key resistance zone, where sellers may regain control. This level has been a strong area of interest in the past, suggesting the potential for another bearish reaction if sellers step in.
If the price confirms rejection from this zone, a move lower toward 192.000 is likely. However, a strong breakout above could invalidate this setup, shifting momentum back to the bulls.
Traders should monitor for bearish confirmation signals, such as bearish engulfing candles, long upper wicks rejecting the resistance, or increased selling volume before considering short positions.
Let me know your thoughts or any additional insights you might have!

Mister Y - GJ - Friday - 21/03/25 Top down analysisAnalysis done directly on the chart.
We've been seeing volume all week, letting the market
to cool off won't harm anyone. Market doesn't move
in straight lines, it needs to create structure and liquidity
to move.
If you have any questions, leave it in the comment. I'll try
my best to respond.
Not financial advice, DYOR.
Market Flow Strategy
Mister Y

GBP/JPY Downward CorrectionDouble Top completed. Downward correction move to about 192.077 if Double Bottom is respected. If further pushed, TP2 is around 191.176 to the start of the move. Prediction is bullish on higher timeframe at TP2 zone.

GBPJPY SellsSell GBPJPY scenario. This looks like a bearish flag pattern forming. If we can get a break out on the rising support it would be great. Price may decline to as low as 191,0

check the trendConsidering the price behavior in the current resistance level, possible scenarios have been identified. As long as the price fluctuates above the green support level, the continuation of the upward trend is likely.

TODAY’S GBPJPY WONDERMAP!TODAY’S GBPJPY WONDERMAP!
Bulls might be waking up! Price sitting on a strong RBS zone, momentum is key!
📍 Key Levels to Watch:
🟢 Buy Setup: Looking for a pullback to H4 support, H1 breakout, M15 RBS, and M30 swap zone before continuation to the upside.
Stay sharp, follow structure, and let’s wrap up the week in style!

GBP/JPY 15M Analysis & Trade Setup – 21-01-2025📊 GBP/JPY 15M Analysis & Trade Setup – 21-01-2025
📈 Current Price: 193.374
🔴 Supply Zones (Resistance):
✔ 193.269 (Current resistance, waiting for confirmation)
✔ 194.603 (Higher resistance zone)
🟢 Demand Zones (Support):
✔ 192.198 (Potential support level)
📌 Market Outlook:
Price is testing the 193.269 supply zone.
Scenario 1: If price rejects this level, expect a drop towards 192.198 support.
Scenario 2: If price breaks above 193.269 and confirms, it may target 194.603 resistance.
⚡ Trade Setup:
🔻 Sell Setup: If rejection at 193.269
🎯 TP1: 192.198
🛑 SL: Above 193.500
🔼 Buy Setup: If breakout above 193.269 with retest
🎯 TP1: 194.603
🛑 SL: Below 193.000
#GBPJPY #ForexTrading #PriceAction #SmartMoney #TradingAnalysis 🚀📊

Rising Wedges
The image illustrates rising wedges and the prevailing trend, suggesting a strong sell signal on the H4 chart (with the rising wedges completing on the H1 chart). Please proceed with caution and trade at your own risk.

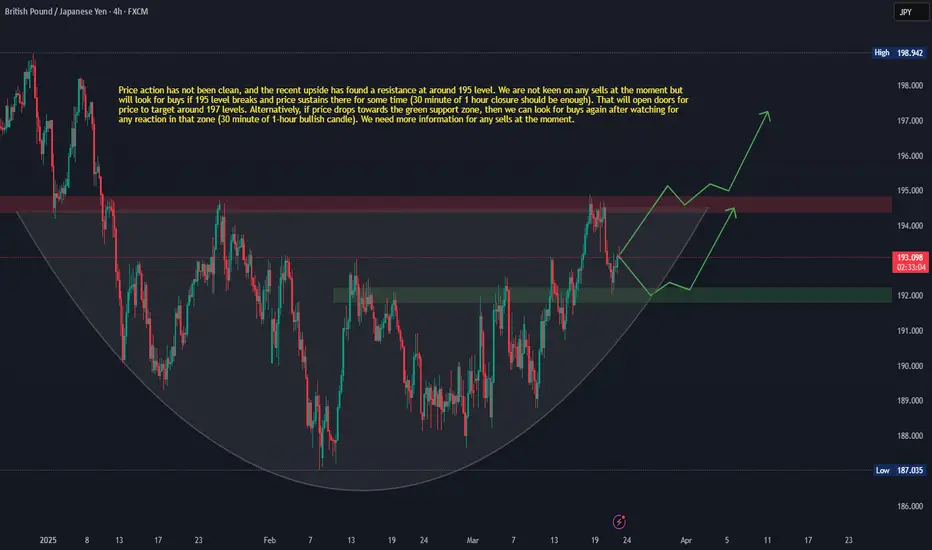
GBPJPY Daily AnalysisPrice action has not been clean, and the recent upside has found a resistance at around 195 level. We are not keen on any sells at the moment but will look for buys if 195 level breaks and price sustains there for some time (30 minute of 1 hour closure should be enough). That will open doors for price to target around 197 levels. Alternatively, if price drops towards the green support zone, then we can look for buys again after watching for any reaction in that zone (30 minute of 1-hour bullish candle). We need more information for any sells at the moment.