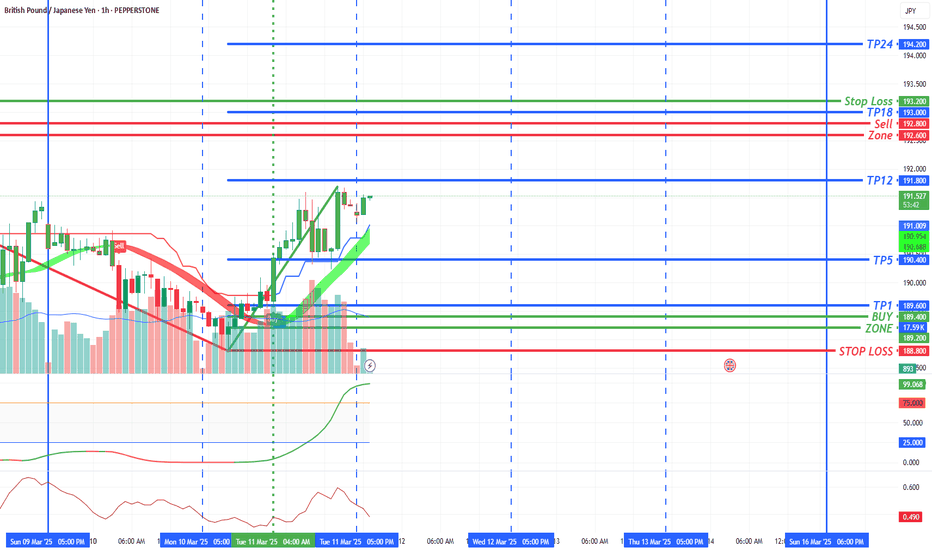
GBPJPY.100.CSM trade ideas
GBPJPY: Market Sentiment & Forecast
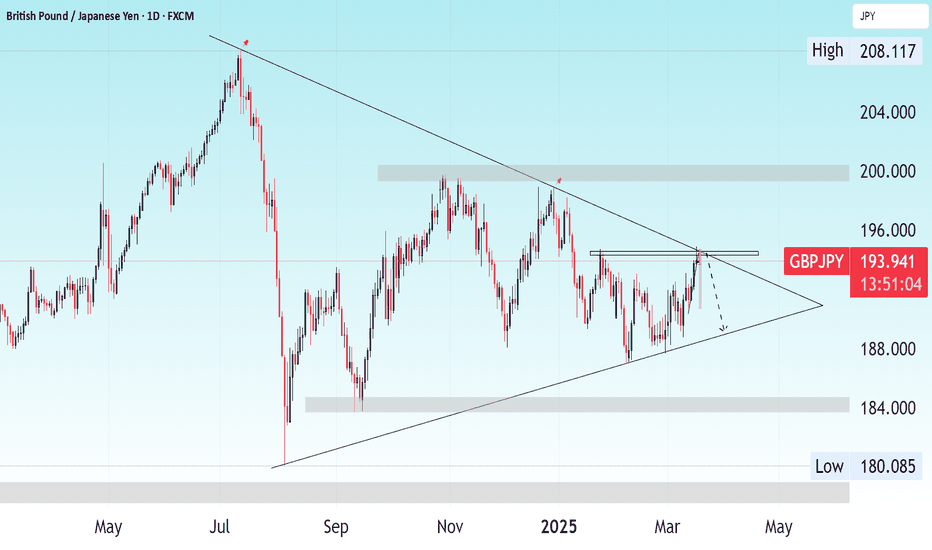
Remember that we can not, and should not impose our will on the market but rather listen to its whims and make profit by following it. And thus shall be done today on the GBPJPY pair which is likely to be pushed down by the bears so we will sell!
Disclosure: I am part of Trade Nation's Influencer program and receive a monthly fee for using their TradingView charts in my analysis.
❤️ Please, support our work with like & comment! ❤️
CHECK GBPJPY ANALYSIS SIGNAL UPDATE > GO AND READ THE CAPTAINBaddy dears friends 👋🏼
(GPBJPY) trading signals technical analysis satup👇🏼
I think now (GBPJPY) ready for( SEEL )trade ( GBPJPY ) SEEL zone
( TRADE SATUP) 👇🏼
ENTRY POINT (194.200) to (194.100) 📊
FIRST TP (193.800)📊
2ND TARGET (193.400) 📊
LAST TARGET (193.000) 📊
STOP LOOS (194.600)❌
Tachincal analysis satup
Fallow risk management
GBP/JPY SELL ZONE .....My GBP/JPY sell zone suggests a bearish outlook with downside targets at 192.480, 191.500, and 190.720, while maintaining a stop loss at 194.600.
Key Levels & Analysis:
Resistance (Stop Loss): 194.600 – If price breaks above this, the bearish setup is invalidated.
Support Levels (Targets):
192.480: First support, minor retracement level.
191.500: Stronger support, potential reaction zone.
190.720: Major support, likely to see profit-taking or reversal signs.
Technical Indicators to Watch:
1. Moving Averages: If GBP/JPY is trading below the 50-day and 200-day moving averages, it strengthens the bearish case.
2. RSI (Relative Strength Index): If RSI is below 50 and trending toward 30, it signals bearish momentum.
3. MACD (Moving Average Convergence Divergence): A bearish crossover below the signal line adds confidence to the downtrend.
4. Trendline & Fibonacci Analysis:
Check for a trendline break or a Fib retracement level supporting the sell-off.
Trading Strategy:
If price rejects resistance at 194.600, it confirms bearish sentiment.
A break below 192.480 could accelerate selling pressure toward 191.500 and beyond.
Monitor Bank of Japan & Bank of England news, risk sentiment (stocks, bonds, yen strength) for additional confirmation.
GBPJPYGBPJPY
GBPJPY has almost completed the " 4th " Impulsive Waves. A Strong Confirmation after it breaks the Lower Trend Line of Bullish Channel and reject with Strong Price Action from the Fibonacci Level - 38.20% / 50.00%
Note :
This is not the Signals , It is only the Technical Analysis for GBPJPY next move
GBP/JPY Breakout Analysis: Bullish MomentumHello traders, this trading idea is based on simple technical analysis. As you can observe, the Pound/Yen pair has broken above 191.984, indicating a stronger presence of buyers than sellers. The target price levels are 193.861 and 195.74. Any price within the range of 190.119 to 191.984 is considered a suitable entry point for buy orders, with a stop-loss set at 188.271
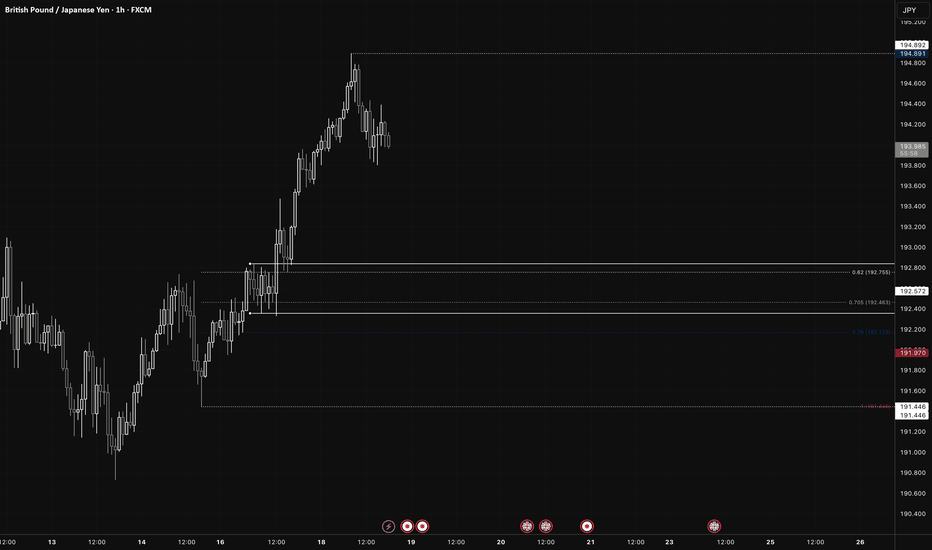
GBP/JPY (Long)Daily:
Price > 200EMA
Swing Period 10
Swing Low: 187.666
Swing Low: 194.892
Volume Imbalance: 2 Candles
Daily Order Block: 197.399 / 195.104
H4:
Price < 200EMA
Swing Period: 7
Swing High: 194.892
Swing Low: 190.728
Volume Imbalance: 2 Candles
H4 Order Block: 192.357 / 192.841
H1:
Swing Period: 5
Swing High: 194.892
Swing Low: 191.446
Volume Imbalance: 11 Candles
H1 Order Block: 192.357 / 192.841
Model 1:
Entry Price: 192.572
Stop Loss: 191.970
TP1: 191.970 @ 1:1 / 50%
TP2: 193.775 @ 1:2 / 25%
SL: Breakeven
TP3: 194.891 @ 1:3 / 25%
Model 2:
Entry Price: 192.750 - 192.159
Entry Trigger: 9EMA X 21EMA
SL: Above recent swing low
TP1: 1:2
SL: Trailing 9EMA
CHECK GBPJPY ANALYSIS SIGNAL UPDATE > GO AND READ THE CAPTAINBaddy dears friends 👋🏼
(GPBJPY) trading signals technical analysis satup👇🏼
I think now (GBPJPY) ready for( SEEL )trade ( GBPJPY ) SEEL zone
( TRADE SATUP) 👇🏼
ENTRY POINT (194.200) to (194.100) 📊
FIRST TP (193.800)📊
2ND TARGET (193.400) 📊
LAST TARGET (193.000) 📊
STOP LOOS (193.600)❌
Tachincal analysis satup
Fallow risk management
Why GBPJPY is Bullish?? Detailed technical and fundamentalsThe GBP/JPY pair has recently confirmed a bullish reversal by breaking out of a falling wedge pattern, aligning with our earlier analysis. Currently trading at 194.000, the pair is on track toward our target of 199.000.
Technically, the breakout from the falling wedge—a pattern typically indicative of bullish reversals—suggests increased buying momentum. This is further supported by the pair's ability to maintain levels above key resistance points, now acting as support. The next significant resistance is anticipated around the 195.000 level, a psychological barrier that, if surpassed, could pave the way toward our 199.000 target.
Fundamentally, the British pound has been bolstered by positive economic indicators, including robust GDP growth and a resilient labor market, enhancing investor confidence. Conversely, the Japanese yen has experienced depreciation due to the Bank of Japan's commitment to ultra-loose monetary policies, aiming to stimulate inflation and economic growth. This monetary policy divergence has contributed to the upward trajectory of GBP/JPY.
In conclusion, the confluence of technical and fundamental factors supports a bullish outlook for GBP/JPY. Traders should monitor upcoming economic releases and central bank communications, as these could impact market sentiment and price action. Maintaining a disciplined approach with appropriate risk management strategies is essential as the pair approaches the 199.000 target.
GBP/JPY 15-Minute Chart Analysis1. Market Structure
The chart indicates a potential reversal or correction after an extended bullish run.
Price reached a strong resistance zone (~194.45 - 194.92) and is now showing signs of rejection.
A bearish retracement is forming, with price breaking a short-term ascending trendline.
2. Key Levels
Resistance Zone (~194.45 - 194.92): This area acted as a supply zone where price faced selling pressure.
Support Zone (~193.30 - 192.90): This is the next potential demand zone where buyers may step in.
3. Bearish Setup Confirmation
The trade setup suggests a short (sell) position, with:
Entry after trendline break (~194.30 - 194.29)
Stop-loss above resistance (~194.92)
Take-profit at next support (~193.30 or 192.90)
The Risk-to-Reward Ratio (RRR) looks favorable, with a target almost twice the risk.
4. Trading Strategy
If Price Stays Below 194.30 → Bearish confirmation; hold sell trade.
If Price Breaks Above 194.92 → Trade invalidation; cut losses.
If Price Drops to 193.30 - 192.90 → Secure profit or trail stop-loss.
5. Additional Confirmation Factors
EMA 50: Price is testing the 50 EMA, which may act as short-term resistance.
Bearish Momentum: Rejection candles at the resistance zone indicate selling pressure.
Conclusion
Primary Bias: Bearish (short-term correction)
Entry Zone: ~194.30 - 194.29
Stop Loss: ~194.92 (above resistance)
Take Profit: ~193.30 or ~192.90
Trade Confirmation: Look for bearish momentum and rejection candles.


