GBPJPY SHORTWe are in a key area in this pair. The fibonacci level is in line with a doji which makes the area a key area. we are hoping to go short over 100 pips.
GBPJPY.100.CSM trade ideas

Long trade
30 min TF overview
Buyside trade
Pair GBPJPY
Tue 11th March 25 4.30 am
Tokyo Session AM
Entry 190.204
Profit level 190.924 (0.38%)
Stop level 190.026 (0.09%)
RR 4.04
Reason: Observing price action since Monday, 10th March 2025 and using the Asia session for liquidity, I assumed a buyside trade idea. Target Asia high

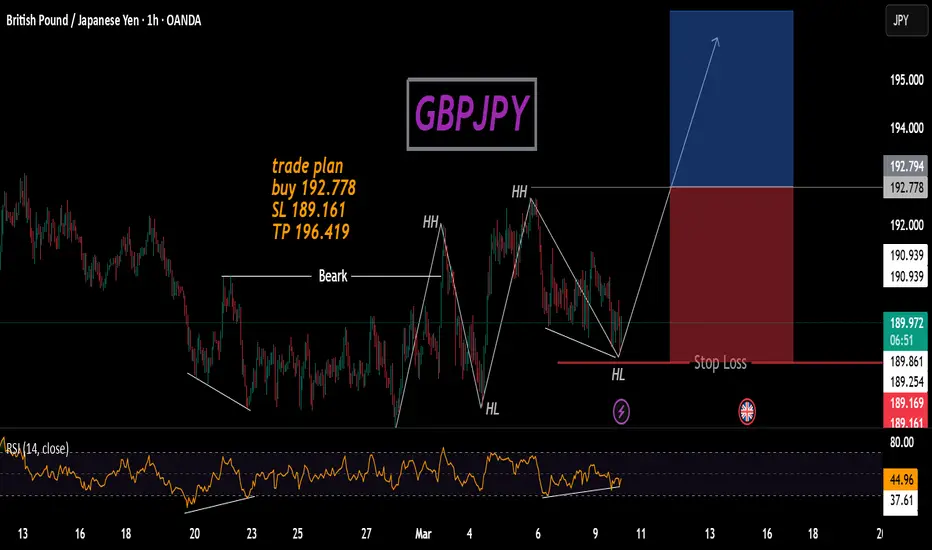
GBPJPY Key Support Retest – Potential Bounce or Break?I've been watching #GBPJPY on the 30-minute chart, and there's a strong support level around 189.91. The price has tested this level multiple times and bounced back each time, showing clear buying interest. Right now, it's retesting the same zone, and if it rejects again, we could see another push to the upside. I'm keeping an eye on this level for a potential long setup, but if it breaks below, further downside could be in play. Waiting for confirmation before making a move!

GBPJPY Sellers In Panic! BUY!
My dear followers,
This is my opinion on the GBPJPY next move:
The asset is approaching an important pivot point 189.48
Bias - Bullish
Technical Indicators: Supper Trend generates a clear signal while Pivot Point HL is currently determining the overall Bullish trend of the market.
Goal - 190.65
About Used Indicators:
For more efficient signals, super-trend is used in combination with other indicators like Pivot Points.
———————————
WISH YOU ALL LUCK

Fractal breaksin this video i wil show my friends how i am looking for a cfractal break. I dont get it how to do it/.

GBPJPY Price ActionHello Traders, Today's setup is based on the 4H timeframe. I identified a clear Quasimodo (QM) or Head-and-Shoulders (HS) pattern visible on both the H4 and 1H charts. After patiently observing market movements, I noticed that the price left behind liquidity and established a demand zone.
I'm now waiting for the market to sweep the liquidity and retest the demand zone before anticipating an upward move. Always ensure you practice strict risk management.
Wishing you the best of luck and happy trading!

GBPJPY LONG Price reached an area of demand where there is a lot of liquidity.
On the 3H time frame price made a bullish reversal candle stick signaling that there is a potential reversal where price can trade long
The reason for entering this trade is due to the reversal candlestick that appears on the 3H timeframe and the retesting of the drawn demand zone and liquidity zone

Short Bias on GBPJPYLooking for sweep on structural liquidity and OB entry across my rectangular box.
Let's see what price does if comes back there.

Today GBPJPY WONDERMAP TODAY’S GBPJPY WONDERMAP! 🔥
Market’s still bearish, expecting a pullback before the drop!
📍 Key Zones to Watch:
🔻 H4 Resistance
🔻 H1 SBR
🔻 M30 Breakout
🔻 M15 Resistance
If price respects these zones, we ride the wave down. Stay sharp, stay disciplined! 🚀
Who’s ready to execute?

GJ | LTF Analysis Based off my hourly analysis from yesterday, price is approaching my POI. It won't let me publish an idea from the 5m timeframe so I have to use the 15m but as you can see I marked out the 5m swing points in price. I am waiting to see price tap that hourly OB and give me a change a of character on the 5 minute time frame meaning price closes aboves the most recent 5 minute swing high. If that happens, i will enter a buy trade and set my target at the 192.540 level that I had marked up previously from yesterday. If you want too, you could place a buy limit order at 188.997 and place your stop loss below the hourly OB zone but it is more risky without seeing an extra layer of confirmation and would use lower risk if you decide to do that. Trade Safe- Remzy

GBPJPY Long1:3 Risk to Reward
High probability trade setup.
80% chance of success.
Risk to reward rating 4/10
Overall rating 6/10

Tue 11th Mar 2025 GBP/JPY Daily Forex Chart Sell SetupGood morning fellow traders. On my Daily Forex charts using the High Probability & Divergence trading methods from my books, I have identified a new trade setup this morning. As usual, you can read my notes on the chart for my thoughts on this setup. The trade being a GBP/JPY Sell. Enjoy the day all. Cheers. Jim

GBPJPY Scenario 11/03/2025English : According to our analysis, we anticipate a BEARISH scenario.
Morocan Darija : kanchofo d'apres l'analyse dyalna GBPJPY antsanaw lhboot
ATENTION : I only share my ideas, not signals.

GBPJPY possible 250pipsAlready in, TP and SL on the chart.
Partial TP around 190.75-191.00
Will be updating


Potential Trade ideasPotential Trade Ideas:
1. Retest & Sell Setup:
• If price pulls back to 190.000 and rejects, this could be a strong sell entry targeting 188.800 or lower.
2. Breakout & Continuation:
• If price breaks and closes below 188.800, expect further downside, with targets at 188.000 and potentially 183.750.
3. Bullish Scenario (Low Probability for Now):
• If price closes above 190.000, consider bullish setups back to 191.500 or trendline resistance.

Overall Movement for GBPJPY: Swing Trade<Oct '11, We can acknowledge that there is a newly formed series of HIGHER HIGHS and HIGHER LOWS, This expounds to us that the market is presently bullish, this is very essential, especially to PURE PRICE ACTION-TRADERS. Concurrently, the bullish trend has mitigated our long awaited SUPPLY ZONE, which I highlighted with my RED MARKER, and as I scaled down into the current DAILY market, I noticed that the market had changed STRUCTURE(CHoCH), this validates our SUPPLY ZONE, that it is Authentic. The MARKET, as anticipated, is going to rally down, fill up the FVGs, and Mitigated the unmitigated DEMAND ZONE(Institutional funded area), marked with a blue highlighter, that created the current Higher High(of the internal bullish trend).

GBP/JPY Long on 1HPrice respects rising support and is bullish on al time frames above 15 min. I a looking for trend continuation
Entry 189,9
SL 189,2
TP1 191.2
TP2 192.3

USDJPY and GBPJPY AnalysisHello traders, this is a complete multiple timeframe analysis of this pair. We see could find significant trading opportunities as per analysis upon price action confirmation we may take this trade. Smash the like button if you find value in this analysis and drop a comment if you have any questions or let me know which pair to cover in my next analysis.

GBPJPY=BUYWe have a regular flat in the making in a higher degree as well as a running flat in the smaller degree, both in H4 timeframe. The price is reacting nicely from the highlighted OB. Either the price will completely take a turn to the upside or make a reversal once the pattern is completed.
Lets see how it goes.

Fundamental Leading CycleFundamental bias leading market not technical.
Where is best market condition to trade

GBPJPY scenario 10/03/2025English : According to our analysis, we anticipate a BEARISH scenario.
Morocan Darija : kanchofo d'apres l'analyse dyalna GBPJPY antsanaw lhboot
ATENTION : I only share my ideas, not signals.
