GBPJPYGBPJPY is looking very strong .As the pair break through the support come resistance level, currently the price is retesting the broken level and looking very bullish for another leg to the upside.
GBPJPY.100.CSM trade ideas

GBP/JPY Bullish Triangle BreakoutLooking at GBP/JPY 15-minute chart, we've identified a symmetrical triangle formation suggesting continuation of the recent bullish momentum.
Trade Setup:
BUY @ 191.80 (Triangle resistance breakout)
SL: 191.50 (Below triangle support)
TP1: 192.20 (Previous resistance)
TP2: 192.50 (Key psychological level)
Risk:Reward = 1:1.33 (TP1) and 1:2.33 (TP2)
This setup offers a high-probability entry with limited downside. The pair has shown strong buying interest after rebounding from 188.00 area. Watch for a clean break above triangle resistance to confirm entry.
Consider partial profit-taking at TP1 to secure gains while allowing remainder to reach extended target.

GBPJPY DECSEDING CHANNEL TREND 📉 GBP/JPY Trading Analysis – 4H Timeframe 📈
GBP/JPY has been consistently following a descending channel, showing bearish momentum.
The current market price is 188.615, with potential for further movement.
A key entry level is identified at 187.300, aligning with technical support.
The target area is set at 191.100, reflecting potential bullish reversal.
EMA 50 serves as a crucial dynamic resistance in the 4-hour timeframe.
If the price retests 187.300, it could provide a strong buying opportunity.
A break above the descending channel may signal trend reversal.
Risk management is essential, with a stop loss placed below 187.000.
Bullish confirmation will be stronger if candlestick patterns support upward movement.
Market sentiment and fundamentals should also be considered.
A breakout above EMA 50 could confirm a bullish trend shift.
Price action near key resistance levels will determine further movement.
If momentum weakens, consolidation may occur before further upside.
Traders should monitor volume and volatility for confirmation.
Patience and discipline are key for a successful trade execution.
#GBPJPY #ForexTrading #TechnicalAnalysis

Bears Take Control of GBP/JPY! Hi traders!
Bulls tried to break through the upper boundary of the channel and the 192 resistance level… but no luck! ❌ Now, the bears are sharpening their claws and setting their sights on 184-182! 🎯

GJ Wednesday LongsPrognosis for GBP/JPY
We should move into OBE and the FVGs below before capitulation upwards.

CRT does it againCRT is all you need. Turtle soup will pay you millions! thats all you need to know!

uptrendIf the price can consolidate above the support trend line, the upward trend will likely continue.

Bullish outlook on GJ This is my outlook for GJ on the hourly timeframe. Kinda the same view I had as yesterday. We can see price actually broke structure on the hourly now. I will want to see price come down back into this hourly demand zone and look to buy back up to the swing high.

GBP JPY, BUYERS ON THE MOVE, Bullish candle breakthroughs the resistance supporting with a body displacement, I can anticipate that the price make turn and go bullish, as buyers making their move supporting pound and sellers dumping yen,
Confirmation after seeking Internal liquidity (PD ARRAYS) for reversal after hitting external liquidity or buy side liquidity
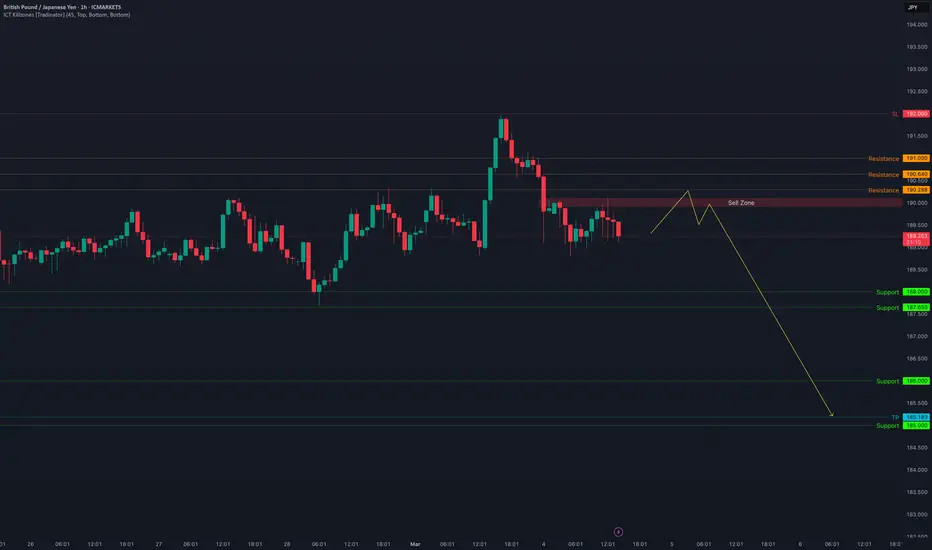
GBP/JPY Overbought area.. The price is approaching a strong resistance level and the overbought zone. We need to be cautious of a potential false breakout, where many traders have their stop losses. Additionally, the pair has moved more than its daily average. This is a very interesting zone for selling, where we are definitely looking for sell opportunities rather than buys.

Gbpjpy for longPrice is consolidating, price already gave a bullish momentum impression. Wait for break and retest of the resistance zone above and bullish candlestick pattern.

Why I Think GBPJPY Will Continue to Sell...Technical Analysis Hey Rich Friends,
Happy Monday. I think GBPJPY will continue to sell this week. Here is what I am looking at:
- The market is approaching a previous area of support. If it breaks below 188.830, there is a strong chance that it will continue to drop. This is a potential sell-stop entry.
- The stochastic is facing down, the slow line (orange) is on top of the fast line (blue), and both lines have crossed below 20. These are strong bearish confirmations for me.
- There is bearish confluence on higher time frames (4H, D1, W1)
- I will be using a previous high for my stop loss, and previous lows as my TPs.
Make sure you check the news and cross-reference your chart before copying trade ideas from anyone.
Peace and Profits,
Cha

GBPJPY SellGBPJPY had a inverse head and shoulders right should possibly failing due to 15 break of structure to possibly continuing to the downside.

GBP/JPY Sell Setup – Inverse Cup & Handle Pattern Confirmed!### **📉 GBP/JPY Sell Setup – Inverse Cup & Handle Pattern Confirmed! 🚀**
GBP/JPY is forming a **bearish inverse cup & handle pattern**, with **EMA50 confirming the downtrend**, making it a strong sell opportunity.
🔹 **Sell Entry:** **189.100**
🔹 **Stop Loss:** **189.700** (60 pips above entry)
### **📊 Take Profit Targets:**
✅ **TP1:** **188.700** (40 pips profit)
✅ **TP2:** **188.300** (80 pips profit)
✅ **TP3:** **187.900** (120 pips profit)
### **📌 Trade Management:**
✔ **Stick to SL & TP levels** to manage risk.
✔ **Secure profits** as price moves towards TP3.
✔ **Use proper position sizing** for risk management.
🔥 **Execute wisely & trade safely! 🚀📉**

Berish confluence for GBPJPYGBPJPY broke the OB in 15tf and after the lq sweep in 30 min it will retest the swing low and break it. After that wait for a correction up to sell.

Trading minute impulseOn the minute timeframe of GBPJPY at the moment we have the completion of the impulse formation. If the price continues to move in the direction of the impulse and the support zones do not allow it to overcome the base of the impulse, it may reach the targets 1 and 2. If the price fails to advance in the direction of the momentum and overcomes the support zone at the base of the momentum, it is very likely that the price will move sideways or against the direction of the momentum. @fxopen

GBPJPY Sell Setup – Bears Eyeing Exhaustion?Looking to sell around 192 if price rallies to that level.
🔍 Why I’m Watching This Trade: ✅ The primary trend remains bearish. ✅ The rally on the daily chart looks near exhaustion. ✅ Better risk/reward if we sell into rallies rather than at current levels.
⚡ Levels to Watch: 🔹 Resistance: 192 (Bespoke resistance) 🔹 Target 190.97
If sellers step in at 192, we could see a push down to 190.97 Let’s see how this plays out! 🚀

GBPJPY is Holding above the Support , All Eyes on BuyingHello Traders
In This Chart GBPJPY HOURLY Forex Forecast By FOREX PLANET
today GBPJPY analysis 👆
🟢This Chart includes_ (GBPJPY market update)
🟢What is The Next Opportunity on GBPJPY Market
🟢how to Enter to the Valid Entry With Assurance Profit
This CHART is For Trader's that Want to Improve Their Technical Analysis Skills and Their Trading By Understanding How To Analyze The Market Using Multiple Timeframes and Understanding The Bigger Picture on the Charts

GBPJPY Trade Ideahe GBP/JPY pared some of its gains after a massive jump yesterday. It hit an intraday high of 191.98 and is currently trading around 189.52. Intraday trend is bearish as long as resistance resistance 192 holds.
The UK Manufacturing PMI in February 2025 was 46.9, improved from the flash reading of 46.4, but still showing a sharp contraction in the sector, the biggest since December 2023. Output has fallen for four months running, coupled with steep falls in employment and backlogs. Rising energy and raw materials prices have driven input cost inflation upwards, which has led to the largest factory gate price increase since April 2023. The sub-50 PMI reading reflects bearish implications for the Pound Sterling
technical Analysis Points to Further Downside
The GBP/JPY pair is trading below 34 and 55 EMA (Short-term) and 200 EMA (long-term on the 4-hour chart, confirming a bearish trend. Immediate resistance is at 190.35, a breach above this level targets of 190.64/191/192. Any close above 192 in the 4-hour chart confirms further bullishness. Downside support is at 188 with additional levels at 187.65/187.25/186/185.
Market Indicators
CCI (50)- Neutral
Directional movement index - Neutral.
It is recommended to sell on rallies around 190 with a stop-loss at 192 for a TP of 185.
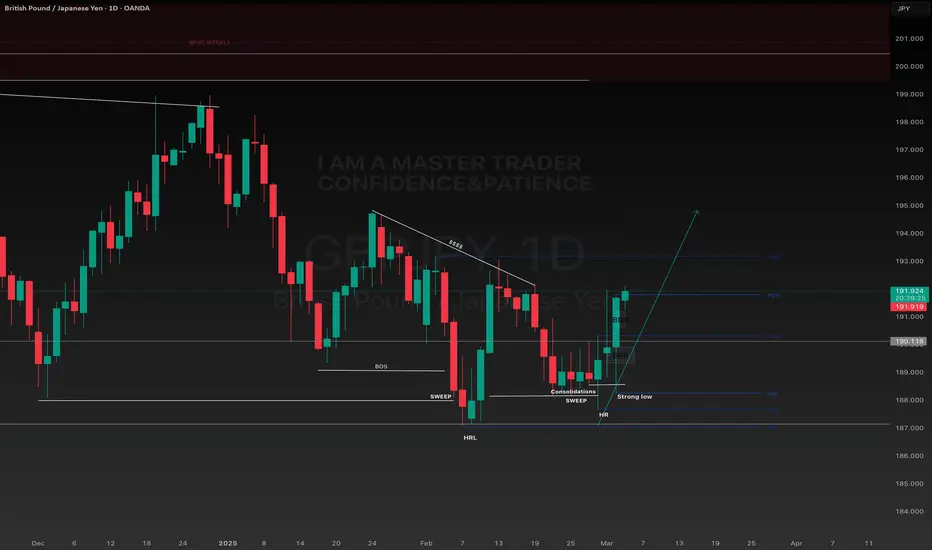
GBP/JPY e Analysis & Probability Estimation March 4 2025Key Observations Across Timeframes:
1. Market Structure & Trend Analysis:
Short-term (M15, M30):
Price is consolidating near 189.200, testing the previous daily low (PDL) for liquidity.
A Break of Structure (BOS) occurred, signaling short-term bearish control.
The price is hovering at a key demand zone (PWL - 188.500/187.800).
If price breaks below 188.800, further downside is likely.
Mid-term (H1, H4):
The price rejected equilibrium (~189.800 - 190.000), showing weakness.
A Change of Character (ChOCH) to the downside suggests a bearish trend continuation.
Liquidity below PWL (187.800) could be a target before a potential bounce.
Long-term (D1):
The price is in a larger downtrend, failing to break above premium zones (~190.500 - 192.000).
Liquidity below PWL (~188.000 - 187.500) is uncollected, making it a likely target.
The next major support lies in the discount zone (~185.500 - 186.500).
2. Key Liquidity Zones & Supply/Demand Areas:
Premium Zone (~190.500 - 192.000): Major resistance; rejection happened here.
Equilibrium (~189.800 - 190.000): Price failed to hold above, signaling weakness.
Discount Zone (~187.500 - 186.500): Next strong demand area if price continues lower.
Previous Daily Low (PDL - 188.800): Price is testing this level for liquidity; a break here could lead to further downside.
Previous Weekly Low (PWL - 187.500): Untapped liquidity below, making it a strong target for price movement.
Probability-Based Scenarios:
1. Bearish Continuation to 187.800 - 186.500 (Break Below PDL & PWL)
Probability: 65%
Reasons:
Failure to hold above equilibrium (189.800).
Bearish BOS & ChOCH confirmations on H1/H4 suggest a move down.
Liquidity below 188.000 (PWL) remains uncollected.
Strong daily downtrend supports further downside.
Bearish Confirmation:
If price breaks and holds below 188.800, expect a move toward 187.500 - 186.500.
2. Bullish Reversal from Discount Zone (Bounce from 188.500 - 187.500)
Probability: 35%
Reasons:
Potential liquidity grab at PWL (188.000 - 187.500) before reversing.
Demand zone at 187.500 - 186.500 could cause a bullish reaction.
If price holds above 188.800, we may see a bounce to 189.800 - 190.000.
Bullish Confirmation:
If price fails to break below 188.500, a push back toward equilibrium (189.800) is possible.
Final Thoughts & Trade Plan:
Bearish bias (65% probability) for continuation toward 187.800 - 186.500.
Key Confirmation Levels:
Below 188.800: Bearish toward 187.500 - 186.500.
Above 189.200: Potential bullish recovery toward 189.800 - 190.000.
Trade Setup Overview:
Bias: Bearish (65% probability)
Entry Type: Breakout & Retest
📉 Sell (Short) Trade Setup:
🔴 Entry: Below 188.800 (Confirmed BOS)
🎯 Take Profit (TP) Targets:
TP1: 188.200 (PWL - Previous Weekly Low)
TP2: 187.800 (Liquidity sweep level)
TP3: 186.500 (Major discount zone)
🛑 Stop Loss (SL): 189.400 (Above minor liquidity)
📊 Risk-to-Reward (R:R):
TP1: ~1:2
TP2: ~1:3
TP3: ~1:5
🔹 Confirmation Needed:
Strong candle close below 188.800 (Break & retest scenario)
No immediate bullish rejection at 188.500
📈 Buy (Long) Trade Setup (Lower Probability - 35%)
🟢 Entry: Above 189.200 (Bullish rejection & BOS)
🎯 Take Profit (TP) Targets:
TP1: 189.800 (Equilibrium zone)
TP2: 190.500 (Supply zone)
TP3: 191.500 (Major resistance)
🛑 Stop Loss (SL): 188.700 (Below structure low)
📊 Risk-to-Reward (R:R):
TP1: ~1:2
TP2: ~1:3
TP3: ~1:5
🔹 Confirmation Needed:
Price needs to hold above 189.200 with strong bullish momentum.
No immediate rejection from equilibrium (189.800).
🛠️ Execution Tips:
🔄 Wait for a clear breakout & retest before entering.
⚖️ Adjust lot size based on risk tolerance (~1-2% per trade).
🕰️ Monitor price action on the lower timeframes (M15/M30) for entry precision.

GBPJPY Finally Breaks Out Of Range: Should We Buy?I am buying GJ...
- BOS
- Bullish CHoCH
- Creating new HHs and HLs
- Retest of Bullish OB
- Sell side liquidity grab
Entry 189.347
SL 188.6
TP1 189.547
TP2 189.847
TP3 190.347
TP4 191.347
I have a price alert set for 190. Let's see how it goes...

GBPJPY SELLERS STILL HOLDING THE MARKETOn daily time frame, Sellers still holding on as the price didn’t breakthrough with a body candle stick leaving a price balance range on lower time frame which indicates a strong reversal going bearish, if the BPR gets respected it will continue to go down.

GBP/USD NEW IDEA 1HOUR CHART TECHNICAL ANALYSIS.This chart represents a technical analysis of the GBP/JPY (British Pound / Japanese Yen) pair on the 1-hour timeframe. It highlights support and resistance levels, key price movements, and potential future direction.
Key Observations:
1. Support Level (Yellow Zone - ~189.000)
This area has acted as a strong demand zone where price has bounced multiple times.
If the price reaches this zone again and holds, a bullish bounce is possible.
2. Resistance Level (Red Zone - ~192.000)
This area has acted as a strong supply zone where sellers have stepped in.
Price reached this level, got rejected (highlighted with an orange circle), and started dropping.
If price moves up again and reaches this zone, another rejection or breakout might occur.
3. Current Price Action (~189.789)
The price is between support and resistance, consolidating around 189.800.
The blue arrow projections suggest two possibilities:
A bullish move if price holds above support.
A breakout towards resistance if momentum increases.
Trading Plan:
Buy (Long) Setup: If price tests the support zone (189.000) and shows bullish confirmation, it can be a good buying opportunity towards 192.000.
Sell (Short) Setup: If price reaches the resistance zone (192.000) and gets rejected again, a sell trade could be considered.
Breakout Trade: If price breaks above 192.000, it could continue higher. If it breaks below 189.000, further downside is expected.
This chart provides a clear roadmap for potential trades based on support and resistance. Let me know if you need a more detailed breakdown!
